
Learning and Evaluation/Evaluation reports/2013/WLM
This is the Program Evaluation page for Wiki Loves Monuments. It currently contains information based on data been collected in late 2013 and will be updated on a regular basis. For additional information about this first round of evaluation, please see the overview page.
This page reports data for three program leaders, about a total of 27 Wiki Loves Monuments implementations, which includes 24 that were mined for additional data. Data requests for this survey conflicted with the end of Wiki Loves Monuments 2013, therefore we had to supplement data ourselves, collecting data for 24 implementations using publicly accessible data and tools. We also had program leaders representing those 24 implementations confirm data per our request.
Key lessons include:
- The more participants, the more photos uploaded; however, the more money spent to implement a Wiki Loves Monuments event doesn't equal higher participant counts or more photo uploads. Just because an event invests more money in implementing their Wiki Loves Monuments, doesn't mean they'll attract more participants, or result in a higher upload count than those events that have lower budgets.
- A very small percentage of images (0.08%) from Wiki Loves Monuments 2012 are rated as Quality, Valued and/or Featured pictures, and at time of data collection, it was too soon to know quality ratings for Wiki Loves Monuments 2013. The small percentage of quality ratings makes it impossible at this point in time to determine what the overall quality of the produced content is.
- About 17% of the images uploaded through Wiki Loves Monuments 2012 are in use on our projects. These are the photos that are getting the most views and therefore have the most impact on our readers. We don't know at this point how many of the pictures are getting re-used on other websites, so the actual usage might be higher.
- The majority of Wiki Loves Monuments participants are new users; however, the survival rate of new users is low (1.7% of the 2012 participants made at least one edit and 1.4% uploaded at least one new file to Commons six months after the event). Not surprisingly, existing editors who participate in Wiki Loves Monuments are retained at higher numbers.
- Half of the existing editors who participated in Wiki Loves Monuments 2012 also participated in Wiki Loves Monuments 2013, with new users making up for the other half. While new user retention is low for 2012, new users help offset the existing editors who didn't participate in Wiki Loves Monuments 2013.
- The global Wiki Loves Monuments organizing team helps support Wiki Loves Monuments organizers around the world, providing replication opportunities via direct support. This makes it easier for someone to organize their own Wiki Loves Monuments contest.
- It's obvious that Wiki Loves Monuments is successful at increasing the number of freely licensed images of historic monuments, but is it successful at educating participants about open knowledge and free licensing? We suggest better initiatives to educate participants, and qualitative surveying to explore if Wiki Loves Monuments is indeed successful at encouraging known support and education about these two areas, which was a selected priority goal.
Planning a Wiki Loves Monuments or other photo upload event? Check out some process, tracking, and reporting tools in our portal and find some helpful tips and links on this resource page
Program basics and history[edit]

Wiki Loves Monuments is the world's largest photo competition. The goal of Wiki Loves Monuments is to document the entirety of historic buildings and places around the world through photographs, which are then uploaded to Wikimedia Commons. The project, which was first held in the Netherlands in 2010, is held every September, lasting the entire month. Wiki Loves Monuments uses government generated lists of historic monuments and places to create on-wiki lists that guide participants to monuments and places needing photographs. Participants from more than 50 countries (as of 2013) photograph the listed buildings and places and then upload the photos under free licenses to Wikimedia Commons. On wiki, volunteers categorize and might distribute the images to appropriate Wikipedia articles.
Each country that participants in Wiki Loves Monuments has a jury that reviews each photograph submitted for their specific country. Juries usually comprise of professional photographers, cultural heritage academics, and Wikimedians. The images are reviewed base on quality and value of the image. Generally, the jury selects the 10 best photographs submitted within their country. Prizes are often awarded to the top three, and sometimes, exhibitions are held for the winning photos. Each country submits their top ten images to the international Wiki Loves Monuments jury, who then reviews the images and awards prizes for the winners. There are also special awards, which are sponsored by organizations. Prizes vary, from a grand prize trip to Wikimania 2014 in London, to photography related gear and money.
Data report[edit]
Response rates and data quality/limitations[edit]
Three program leaders submitted data, and we mined data for 24 additional WLM implementations.
Collecting Wiki Loves Monuments data for 2013 was particularly challenging, since our request for data collection responses fell during the time period when Wiki Loves Monuments 2013 was being completed. Only three program leaders reported a Wiki Loves Monuments implementation directly to us. To supplement the need for data, we collected data from an additional 24 Wiki Loves Monuments implementations from 2012 and 2013 which had received grants through the Wikimedia Foundation, including FDC funding. These implementations included specific budgets for each Wiki Loves Monuments contest. In total, we evaluated 27 Wiki Loves Monuments implementations: 12 from 2012 and 15 from 2013.
| Year of Wiki Loves Monuments | Number of implementations used for this report |
|---|---|
| 2012 | 12 |
| 2013 | 15 |
| Total | 27 |
For the 24 mined Wiki Loves Monuments implementations, we used publicly available information that was found on organizer websites and on wiki. We were able to collect information about: number of participants, number of photos added, number of photos used in the projects, and ratings of photo quality (Featured, Quality, Valued). We were unable to determine priority goals or input hours through this process of mining the data, but we did contact program leaders for the 24 mined Wiki Loves Monuments implementations to review and confirm the numbers gathered, and to share whether they had used additional funds or any donated resources. However, since we did not gather the complete set of reporting questions from those program leaders whose implementations were mined, we also do not know there program status in terms of shared learning. Still, this report does not represent findings from all Wiki Loves Monuments events, and does not reflect the value of the many hours of volunteer time that are input into planning and implementing these events.
Report on the submitted and mined data[edit]
Priority goals[edit]
- Program leaders for both Wiki Loves Monuments and other photo upload initiatives reported twelve priority goals, with the two most popular focusing on bringing awareness to more people about Wikimedia projects and having fun.
Since Wiki Loves Monuments has similar goals to other photo-based competitions, the goals of these were analyzed together. Five Program Leaders reported their "priority" goals for their photo upload events (100% of those providing direct report). Participants selected between 4 and 14 priority goals for their upload events. [1] Looking at the aggregate selection of priority goals for content donations, only two goals stood out as priority across implementations, however, many were selected by the majority of the five reporting program leaders. The top two goals, selected by four of the five program leaders, were to (1) Increase awareness of Wikimedia and its projects and (2) Make contributing fun, although, clearly, increasing contributions, in terms of photo content, is very much a core target of all these events (see Table below).

Inputs[edit]
- In order to learn more about the inputs that went into planning workshops, we asked program leaders to report on
- The budget that went into planning and implementing the workshop
- The hours that went into planning and implementing the workshop
- Any donations that they might have received for the event: a venue, equipment, food, drink, giveaways, etc.
Budget[edit]
- Reported budgets were available for the majority of Wiki Loves Monuments contests. The average national contest costs just over $3,600 US to implement.
Reported budgets were provided for 26 Wiki Loves Monuments implementations (96%). One event, directly reported, indicated only volunteer hours. Budgeted costs for Wiki Loves Monuments ranged from $392.05 to $29,101.59 with an average[2] of $3,614.50. [3]
Hours[edit]
- Too few program leaders and implementations reported staff and volunteer hours for us to provide an evaluation for this pilot report.
Due to a low response rate by program leaders on this pilot survey, we are unable to report a solid evaluation on input hours for Wiki Loves Monuments at this time. We obtained data on staff input hours for only one, and volunteer hours for just two, directly reported WLM implementations.
Donated resources[edit]
- The majority of Wiki Loves Monuments implementations used donated resources, with meeting space and prizes/give-aways being the most common.
The majority of Wiki Loves Monuments implementations (78%) reported whether they had used any donated resources. More than half of the implementations reported using donated meeting space (62%) and donated prizes/give-aways (52%). In addition, 19 percent reported using materials/equipment that were donated and 14 percent used food donations (see Graph 1).

The donated resources most often reported for Wiki Loves Monuments were meeting space (62%) and prizes or give-aways (52%). Wiki Loves Monuments events appear to benefit often from the use of donated resources to carry out the events.
Outputs[edit]
- We also asked about two outputs in this section
- How many participants contributed to Wiki Loves Monuments?
- How many of those participants were new users?
We used this output and budget inputs to learn:
- What was the dollar cost for each participant
Participation[edit]
- The average Wiki Loves Monuments implementation has 190 participants. For 2012, the majority of participants were new users, making up 87% of the participant base.
We were able to collect participant numbers for all 27 Wiki Loves Monuments implementations. The number of participants in the national contests ranged from 67 to 2,005 people. The average national contest has 190 participants.[4] The majority (87%) of users who participated in Wiki Loves Monuments 2012 were new users. We were unable to gather this information for Wiki Loves Monuments 2013, since the contest was just ending as we were analyzing the data.
- On average, Wiki Loves Monuments implementations cost about $14.50 USD per participant.
Budget and participant count was available for 26 of the 27 implementations used in this evaluation. Looking at programming costs in terms of the number of participants, we learned that programming costs ranged from $1.20 USD to $326.98 USD and averaged $14.58 USD per participant.[5]
Outcomes[edit]
Content Production and Quality Improvement[6][edit]
- The average national Wiki Loves Monuments contest leads to just over 5,600 photos uploaded to Commons during the month of September. For Wiki Loves Monuments 2012, the average number of photos placed in Wikimedia projects was 885.
We collected photo upload counts for all 27 WLM implementations. Upload counts ranged from 1,572 to 32,987 (Graphs 2 and 3). The average event uploaded 5,635[7] photos during the month of September 2012 or 2013.
Regarding image use:
- Wiki Loves Monuments 2012 data for image use ranged from 387 to 6,103 unique images used. The average number of images used from a 2012 Wiki Loves Monuments event was 885.[8] 2012 also shows us that the more images uploaded, the more images are used (see Graph 4).
- Wiki Loves Monuments 2013 data for image use ranged from 10 to 1,687 unique imaged used. The average number of unique images used from a 2013 Wiki Loves Monuments event was 262[9][10] (see Graph 5).
Do note that the numbers reported for 2013 are not final. Since the event ended around the time that we were collecting data, we expect image use in Wikimedia projects to rise.
- The average Wiki Loves Monuments photo upload costs almost 50 cents USD. However, more money spent on a national Wiki Loves Monuments event does not necessarily relate to more participants or more image uploads.
Based on reported budgets for Wiki Loves Monuments implementations and the actual photo uploads, the amount of dollars spent for each photo uploaded ranged from $0.09 USD to $9.17 USD each. The average implementation cost $0.48 USD [11] per photo. We also looked at how much it cost in terms of Wiki Loves Monuments photos which were used on Wikimedia projects. For 2012 implementations, the cost per used photo ranged from $0.51 USD to $26.51 USD, averaging $2.43 USD[12] per image. There does not seem to be a direct relationship between budget, participant count, or images uploaded (see Graphs 2-5).
-
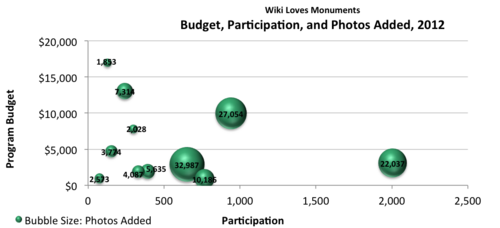 Graph 2: Budget, participation, and photos added.
As illustrated in the graph, budget inputs ranging from less than $1,000 USD to almost $17,000 USD. The number of participants ranged from 75 to 2,005, while the number of images added ranged from nearly 2,000 to more than 30,000. The varying sizes of the bubbles — with larger bubbles representing more images uploaded — show that the number of photos increase significantly when events have over 500 participants. There does not seem to be a direct relationship between budget, participant count, or images uploaded. The bubble size doesn't get larger or smaller — meaning when more money is invested in an Wiki Loves Monuments implementation, that doesn't mean the event will have a higher participant count or a higher upload count. -
![Graph 3: Budget, participation, and photos added. As illustrated in the graph, budget inputs ranged from less than $500 (USD) to nearly $30,000 (USD)[13] and number of participants ranged from as few as 67 and as many as 1485. The number of photos/media added (illustrated by bubble size and label in the graph) ranged from more than 15,00 to nearly 25,000. It appears from the varying sizes of the bubbles on the graph (larger bubbles representing more photos added) that the number of photos added increases along with the number of participants. We also see that event participant counts had a much more stable range of participant numbers for the majority of events, with the median 50% reporting between 156 to 208 participants. Unlike the graph for 2012, we see that the largest bubbles, representing the greatest number of photos added, seem appearing at lower budget levels.](//upload.wikimedia.org/wikipedia/commons/thumb/5/58/WLM_3_Budget_Participation_Photos_Added_2013.png/404px-WLM_3_Budget_Participation_Photos_Added_2013.png) Graph 3: Budget, participation, and photos added.
Graph 3: Budget, participation, and photos added.
As illustrated in the graph, budget inputs ranged from less than $500 (USD) to nearly $30,000 (USD)[13] and number of participants ranged from as few as 67 and as many as 1485. The number of photos/media added (illustrated by bubble size and label in the graph) ranged from more than 15,00 to nearly 25,000. It appears from the varying sizes of the bubbles on the graph (larger bubbles representing more photos added) that the number of photos added increases along with the number of participants. We also see that event participant counts had a much more stable range of participant numbers for the majority of events, with the median 50% reporting between 156 to 208 participants. Unlike the graph for 2012, we see that the largest bubbles, representing the greatest number of photos added, seem appearing at lower budget levels.

![Graph 3: Budget, participation, and photos added. As illustrated in the graph, budget inputs ranged from less than $500 (USD) to nearly $30,000 (USD)[13] and number of participants ranged from as few as 67 and as many as 1485. The number of photos/media added (illustrated by bubble size and label in the graph) ranged from more than 15,00 to nearly 25,000. It appears from the varying sizes of the bubbles on the graph (larger bubbles representing more photos added) that the number of photos added increases along with the number of participants. We also see that event participant counts had a much more stable range of participant numbers for the majority of events, with the median 50% reporting between 156 to 208 participants. Unlike the graph for 2012, we see that the largest bubbles, representing the greatest number of photos added, seem appearing at lower budget levels.](/wiki/File:WLM_3_Budget_Participation_Photos_Added_2013.png)
-
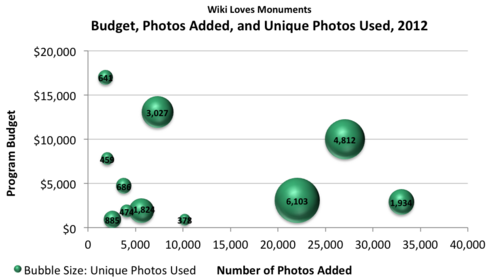 Graph 4: Budget, photos added, and unique photos used for 2012.
This bubble graph compares the number of photos added with the budget, using bubble size to show how many unique photos were added to Wikipedia pages for 2012 competitions. We generally see that as the number of total photos added increased, the number of photos used on Wikipedia pages also increases. -
 Graph 5: Budget, photos added, unique photos used for 2013.
This bubble graph compares the number of photos added with the budget, using bubble size to show how many photos were added to Wikipedia pages for 2013 competitions. There has not been sufficient time after the end of the competitions to allow photos to be uploaded to Wikipedia pages, showing that the largest number of photos used is only 1,687, even though total photos uploaded is around 25,000.


This boxplot shows the distribution of 2012 and 2013 Wiki Loves Monuments competitions. In comparing between the two years, we see that the dollar cost per photo range was greater in 2012 than in 2013; however, the median cost was lower for 2012 at $0.37 per photo added. This suggests that spending per photo between both years may not be very different. More data would be needed to confirm.
Photo quality ratings[edit]
- Only a very small percentage (0.8%) of Wiki Loves Monuments 2012 images are rated as Quality, Valued and/or Featured Images on Wikimedia Commons.
This section focuses only on images uploaded for Wiki Loves Monuments 2012, since the 2013 competition had was just ending as we finished of our data collection; not enough time had passed for ratings to have been awarded at that time.
By November 2013, about 13 months after the 2012 contests ended, out of the 12 contests examined, five (42%) had Quality images, three (25%) had Valued images, and most (7 contests, 58%) had Featured Pictures associated with them. Out of the 126,424 photo uploads we examined for Wiki Loves Monuments 2012, 994 (0.8%) were rated as a Quality Image, Valued Image, or Featured Picture (see Graph 8). Out of those 994 rated photos[14]:
- 932 (94%) were rated as Quality Images. Reports of images rated as Quality ranged from 0 to 484 with the majority (91%) of Quality images generated by only two contests, one which contributed 484 (52%), and another which contributed 364 (39%).
- 30 (3%) were rated as Valued Images. Reports of images rated as Valued ranged from 0 to 27 with the majority (90%) of Valued images generated by one contest.
- 32 (3%) were rated as Featured Pictures. Reports of Featured Pictures ranged from 0 to 17 and were associated with several of the contests.
Importantly, that the majority of images rated Quality and Valued generating from only one or two contests, indicating that those program leaders are likely doing something that others are not in order to achieve these ratings.
-
 Graph 7: Total rated photos vs. unrated photos.
This pie graph compares how many photos were rated to how many were unrated out of all the photos that were uploaded during Wiki Loves Monuments events. The number of rated photos is about 0.08% of the total number of photos uploaded for all Wiki Loves Monuments in 2012. -
 Graph 8: Quality ratings broken down by category.
This pie graph compares only the photos that received a rating of Quality, Valued or Featured image for WLM 2012. Of all the photos that received a quality rating, 94% received a Quality rating, 3% were rated as Valued images, and 3% were rated as Featured images. Due to the method for which ratings are granted to images, each photo may be included in more than one quality category.


Recruitment and Retention of New Editors[edit]
As of reporting time, we were only able to evaluate recruitment and retention of active users for 2012. A few things to remember with this section:
- An active retained user is considered one that makes 5 or more edits a month. [15] We examined both the "pages created" (a new page gets created when someone uploads a file) and "edit count" using Wikimetrics to measure user activity on Wikimedia Commons.
- A "survived" editor is defined as one that made at least one edit in a given window of time after the event ended.
- User retention was measured for both survival and active user retention. Retention was assessed for the first three months after the event (Quarter 1) and the second set of three months (Quarter 2: months four, five, and six) following the event. Here we considered users as surviving if they had made a single contribution, and "active" if they had averaged [16]5 or more edits a month, during the follow-up window.
- We couldn't isolate only Wiki Loves Monuments uploads so user contributions and retention numbers are based on any contributions made by participants during September 2012, and the three and six month retention dates.
- Three month follow-up represents the first quarter following the event, from October to December 2012.
- Six month follow-up represents the second quarter following the event, from January to March 2013.
New users[edit]
- Six months after the end of Wiki Loves Monuments 2012, 0.4% of new users were retained as active contributors to Wikimedia Commons.
Due to Wiki Loves Monuments 2013 ending recently, recruitment and retention data for only 2012 competitions is reported here. Our retention period of 3 months examines the number of uploads over the 3-month period from October to December 2012 while the 6-month retention period lasts through March 2013. The count of uploads per user is pooled; that is, the number of uploads from October through December of 2012 are counted together. Thus, in order to measure 5+ edits per month, we actually use a limit of 15 edits over three months for the 3- and 6-month follow-up point.
For these data, we used Wikimetrics to calculate the number of pages created in namespace 6 for files of Wikimedia Commons. The pages created option in Wikimetrics includes not only photos uploaded, but may also count videos and audio files added. We are unable to isolate just photos uploaded from these other possible media types, so user activity may include these as well. We also could not isolate photos uploaded for Wiki Loves Monuments, versus for other reasons, during the month of September so that the counts associated with the month September are not necessarily photos for the contest. For instance, in 2012, this made for the observation of 399,123 pages created by the full cohort of new and existing users while the actual number of photos uploaded specifically for Wiki Loves Monuments 2012 was 365,322, 8.4% of the pages created by the cohort of contributors were not photos for Wiki Loves Monuments. In addition to pages created, we also examined Wiki Loves Monuments participant behavior in terms of their edit count on Commons. Edit counts may include creation of a new file page, edits to category or other information on an existing file, or new versions of the image that may be uploaded.
13,179 new users[17] participated in Wiki Loves Monuments 2012. 5,399 (41%) of these uploaded five or more files and 5,552 (42%) made five or more edits in September 2012. In regard to retention (see Graph 9):
- Three-month follow-up (First quarter: October–December 2012)
- Survival (Any contributions)
- 797 (6%) of new users from Wiki Loves Monuments 2012 had made at least one edit and 627 (4.8%) had uploaded at least one new file to Wikimedia Commons.
- Active (Average 5+ contributions a month)
- 152 (1.2%) of new users from Wiki Loves Monuments 2012 uploaded 15+ files during the first quarter of retention follow-up.
- 221 (1.7%) of new users from Wiki Loves Monuments 2012 succeeded at making 15+ edits during the first quarter of retention follow-up.
- Survival (Any contributions)
- Six-month follow-up (Second quarter: January–March 2013)
- Survival (Any contributions)
- 220 (1.7%) of new users from Wiki Loves Monuments 2012 had made at least one edit and 187 (1.4%) had uploaded at least one new file to Wikimedia Commons.
- Active (Average 5+ contributions a month)
- 47 (0.4%) of new users from Wiki Loves Monuments 2012 uploaded an average of 15+ files during the second quarter of retention follow-up.
- 59 (0.4%) of new users from Wiki Loves Monuments 2012 succeeded at making 15+ edits during the second quarter of retention follow-up.
- Survival (Any contributions)
Although new user activity declined over the three and six month follow-up periods, during the month of Wiki Love Monuments in 2013, there was an increase in activity for the new users from Wiki Loves Monuments 2012. In September 2013, 451 of the previous new user cohort (3.4%) contributed photos/media to Commons. Of those previously new users which were active that month, 306 (68%) added five or more files during the 2013 contest time.
-
 Graph 9: New user retention, 2012.
This bar graph shows the number of new users retained for periods of three months at three and six months following the event, as well as during Wiki Loves Monuments 2013. A total of 13,179 new users participated in Wiki Loves Monuments 2012. Interestingly, measuring activity by edit count captured significantly more active users in the initial months following the contest, however, the added value of the edit count metric diminishes over time for new users.

Existing users[edit]
- Not surprisingly, existing editor retention is higher than new user retention for Wiki Loves Monuments, with 29% actively uploading files and 57% actively editing on Wikimedia Commons six months after the event ended. Half of the existing users who participated in Wiki Loves Monuments 2012 also participated in Wiki Loves Monuments 2013. The number of returning existing contributors seen for Wiki Loves Monuments 2013 was, for the most part, replenished by those Wiki Loves Monuments 2012 contributors who were retained as near the same number of existing users who participated in 2012 did not return for 2013's competition.
1,632 existing users participated in Wiki Loves Monuments 2012. 1,236 (76%) of these uploaded five or more files and 1,307 (80%) made five or more edits during the contest in September. In regards to retention (see Graph 10):
- Three-month follow-up (First quarter: October–December 2012)
- Survival (Any contributions)
- 1,073 (66%) of existing users from Wiki Loves Monuments 2012 had made at least one edit and 975 (60%) had uploaded at least one new file to Wikimedia Commons.
- Active (Average 5+ contributions a month)
- 566 (35%) of existing users from Wiki Loves Monuments 2012 uploaded 15+ files during the first quarter of retention follow-up.
- 759 (47%) of existing users from Wiki Loves Monuments 2012 succeeded at making 15+ edits during the first quarter of retention follow-up.
- Survival (Any contributions)
- Six-month follow-up (Second quarter: January–March 2013
- Survival (Any contributions)
- 934 (57%) of existing users from Wiki Loves Monuments 2012 had made at least one edit and 845 (52%) had uploaded at least one new file to Wikimedia Commons.
- Active (Average 5+ contributions a month)
- 477 (29%) of existing users from Wiki Loves Monuments 2012 uploaded an average of 15+ files during the second quarter of retention follow-up.
- 643 (39%) of existing users from Wiki Loves Monuments 2012 succeeded at making 15+ edits during the second quarter of retention follow-up.
- Survival (Any contributions)
Half of the cohort of existing users (811 users) contributing to Wiki Loves Monuments 2012 also uploaded media during Wiki Loves Monuments 2013. Of those 652 users (80%) uploaded five or more new files to Wikimedia Commons during that time. While new editor retention appears low, compared to existing editor retention, the number of new users that returned for Wiki Loves Monuments 2013 (457 previously new users) helps to replenish the pool of returnees for 2013.
-
 Graph 10: Existing user retention, 2012
This bar graph shows the number of existing users retained for periods of three and six months as well as during the following Wiki Loves Monuments. There were a total of 1,632 existing users of Wiki Loves Monuments in 2012. Measuring activity by edit count captured significantly more active users than did the "pages created" metric, capturing 4 to 12% more active users at each measurement point.

Summary, suggestions, and open questions[edit]
How does the program deliver against its goals?[edit]
One of the goals for Wiki Loves Monuments is to increase the number of freely available photos of historical monuments. The program's success in this area is obvious. Over the years, Wiki Loves Monuments has produced an impressive number of images under free license that can be used to illustrate Wikipedia articles, as seen in this table:
| Year | Total number of images uploaded to Wikimedia Commons through Wiki Loves Monuments |
|---|---|
| 2010 | 12,626 |
| 2011 | 169,150 |
| 2012 | 365,335 |
| 2013 | 372,156 |
The sheer amount of new images that got freely available is amazing and it's also very commendable that the global Wiki Loves Monuments organizers were continuously able to broaden the list of countries that participate in the contest.
When it comes to the other goals for Wiki Loves Monuments, like e.g. "making contributing fun", things get more complicated. The number of returning existing contributors seen for Wiki Loves Monuments 2013 indicates that a good amount of long-term Commons photographers enjoyed the 2012 event enough to come back a year later. But a new user survival rate of 1.7% six months after the end of Wiki Loves Monuments 2012 is troubling. Event organizers have crafted a popular event that attracts new contributors to Wikimedia Commons, a major hurdle for the Wikimedia movement throughout all the projects, and they should be commended for doing so. But just like textual contribution campaigns, this image contribution campaign suffers from issues prevalent throughout the Wikimedia projects. Without a significant investment in technical resources to make the contributing and interacting interface on Wikimedia Commons better and community consensus to make Commons more welcoming to newcomers, it's hard to imagine image upload campaigns like Wiki Loves Monuments will achieve a higher retention rate of new contributors. Such challenges within the Wikimedia Commons project are not the fault of event organizers, however, and certainly the significant amount of photos uploaded through Wiki Loves Monuments demonstrates the competitive elements of the photo contest and the act of finding locations and taking and contributing photos indicates they do well at making participating in the Wiki Loves Monuments competition fun, even if the challenges of Wikimedia Commons' user interface and workflows removes enough of the fun that contributors don't stick around.
One of the Wiki Loves Monuments goals that 60% of our survey respondents reported to us is to "Increase the support for open knowledge and the free content movement". Given the number of people who participated in the contest and who had never before released their images under a free license is an indicator of general support for free knowledge, it is unclear what other program mechanics have been put in place in order to achieve a change in attitude among the participants. However, this area offers a lot of potential. For example, it might be possible to include information about the benefits of free licenses in the upload process (maybe at the end of the upload, in order to encourage participants to upload even more images under a free license) or to highlight the benefits of free licenses in press releases and on the local contests' websites.[18]
Overall, Wiki Loves Monuments is one of the biggest success stories of the last couple of years when it comes to programmatic activities that fill content gaps. Its success has been supported by the general shift of the web to become more visual and the widespread availability of photographic devices. And it is one of the very few programs that shows impact at scale.
How does the cost of the program compare to its outcomes?[edit]
Given the fact that a comparably large number of chapters received grant funding, we were able to better establish a basic cost-benefit baseline for Wiki Loves Monuments than for any other program covered in this ongoing evaluation. Keep in mind that given we used data mining from grant reports, this section only addresses Wiki Loves Monuments implementations that were funded by grants, not unfunded implementations.
Our cost-benefit-analysis comprises of data from Wiki Love Monuments implementations from 20 different countries, which received WMF or FDC grant funds, representing 12 out of 35 (34%) countries which participated in 2012 and 15 out of 51 (29%) countries which participated in 2013 (7 countries are represented in both 2012 and 2013 data). The average median budget of these events (2012 and 2013 combined) was $3,615 with a high of $29,102 and a low of $392. The average median number of photos being uploaded to Wikimedia Commons per country was 5,635 with a high of 32,987 and a low of 1,572.
Looking at the cost per uploaded image, we get to the following results:
| Year | Number of countries | Average budget (median) | Average number of uploaded images (median) | Average cost per uploaded image (median) |
|---|---|---|---|---|
| 2012 | 12 | $3,100 | 6,266 | $0.37 |
| 2013 | 15 | $4,129 | 4,102 | $1.02 |
As photos that are being used in Wikipedia articles reach a much larger audience than those that are not included in articles, we also looked into the number of images that are currently (as of November 4, 2013) being used across Wikimedia projects. As the usage of images increases over time, we only included the numbers for 2012:
| Year | Total number of photos uploaded | Photos in use on Wikimedia sites[19] | Percentage of images in use [19] | Cost per used image |
|---|---|---|---|---|
| 2012 | 126,424 | 21,639 | 17% | $3.03[20] |
Knowing the cost for an image that got uploaded through Wiki Loves Monuments and that's also in use on Wikipedia and elsewhere is important as it allows us to compare that number to its equivalent from other photo upload initiatives.
Now, is $3.03 a high or a low price for a photo of a monument that's in use on Wikimedia projects? Ideally, we would like to know how the cost per used photo uploaded through Wiki Loves Monuments compares to the costs in a scenario where we would have relied on business photographers to shoot those monuments. In order to make that comparison, we would need to know the following:
Average time that a Wiki Loves Monuments photographer spends on
- researching the location
- traveling to and from the location
- shooting at the location
- selecting and postprocessing the photos
- uploading the photos
Once we have those numbers, we can calculate the costs that would incur if a professional photographer would offer the same services. Our report on other photo upload events, which will be released next week, contains an example of how this can be done.
How easily can the program be replicated?[edit]
Over the years, the global event team was very effective in continuously improving and promoting the concept, which led to a growing number of countries joining the competition. The global event team also offers support for local organizers about legal advice and questions around promotion, prizes, and potential partners. Furthermore, the global event team has become continuously more sophisticated in documenting the event and providing the community with tools to measure the competition's results. All of this makes Wiki Loves Monuments the one program within our programmatic landscape that has the most cohesive and clear set of goals, measures of success and documentation for replication of success.
Next steps[edit]
- Next steps in brief
- Increased tracking of detailed budgets and donated resource inputs by program leaders.
- Improved ability for program leaders to collect and track staff and volunteer input hours.
- Valuation of volunteer hours input and estimation of comparative costs.
- Use of better tracking systems for participant cohorts to examine recruitment and retention associated with specific contests.
- Increased ability to collect, and/or link to existing, experiential survey data to contests and participant activity.
- Next steps in detail
As with all of the programs reviewed in this report, it is key that efforts are made toward properly tracking and valuing programming inputs in terms of budgets, donated resources, and hours invested in activities related to planning and implementing the contests as well as comparative costs. In addition, it will be important to track particular participant cohorts so we can investigate recruitment and retention. In 2013, the Wiki Loves Monuments dashboards were designed to link to uploader lists by country, so this should be easier in the future. Lastly, further investigation of expectations and efforts directed toward the many other goal priorities is needed, including for the top two goals of: increasing awareness of Wikimedia projects and making contributing fun. To some extent these may be answered by the survey administered by the WLM International team this year; to whatever extent there are relevant survey data there or not, it will be important to more clearly articulate programming activities specifically aligned to those goals and to develop strategies for program leaders to measure those potential outcomes.
Appendix[edit]
Summative Data Table:Wiki Loves Monuments (Raw Data)[edit]
| Year | Percent Reporting | Low | High | Mean | Median | Mode | SD | |||
|---|---|---|---|---|---|---|---|---|---|---|
| Non-Zero Budgets | 2012 | 96% | $392.05 | $29,101.50 | $6,340.68 | $3,614.50 | n/a | $6,516.49 | ||
| Staff Hours | 2012 | 4% | 100.00 | 100.00 | Report count of 1 | 0.00 | 0.00 | 0.00 | ||
| Volunteer Hours | 2012 | 7% | 200.00 | 300.00 | 250.00 | 250.00 | n/a | 70.71 | ||
| Total Hours | 2012 | 7% | 200.00 | 400.00 | 300.00 | 300.00 | n/a | 141.42 | ||
| Donated Meeting Space | 2012 | 62%[21] | Not Applicable - Frequency of selection only | |||||||
| Donated Materials/ Equipment | 2012 | 19%[22] | Not Applicable - Frequency of selection only | |||||||
| Donated Food | 2012 | 14%[23] | Not Applicable - Frequency of selection only | |||||||
| Donated Prizes/Give-aways | 2012 | 52%[24] | Not Applicable - Frequency of selection only | |||||||
| Participants | 2012 | 100% | 67 | 2005 | 394 | 190 | n/a | 456 | ||
| Dollars to Participants | 2012 | 96% | $1.20 | $326.98 | $40.20 | $14.58 | n/a | $66.77 | ||
| Input Hours to Participants | 2012 | 7% | Report Count of 2 | |||||||
| Bytes Added | 2012 | Not Applicable (Photo counts instead) | ||||||||
| Dollars to Text Pages | 2012 | Not Applicable (Photo counts instead) | ||||||||
| Input Hours to Text Pages | 2012 | Not Applicable (Photo counts instead) | ||||||||
| Photos Added | 2012 | 100% | 1572.00 | 32987.00 | 8863.78 | 5635.00 | n/a | 8845.83 | ||
| Dollars to Photos | 2012 | 96% | $0.09 | $9.17 | $1.41 | $0.48 | n/a | $2.00 | ||
| Input Hours to Photos | 2012 | Report Count of One | ||||||||
| Pages Created or Improved | 2012 | Not Applicable (Photo counts instead) | ||||||||
| Dollars to Pages Created/Improved | 2012 | Not Applicable (Photo counts instead) | ||||||||
| Input Hours to Pages Created/Improved | 2012 | Not Applicable (Photo counts instead) | ||||||||
| UNIQUE Photos Used | 2012 | 92% | 378 | 6103 | 1929 | 885 | n/a | 1948 | ||
| UNIQUE Photos Used | 2013 | 100% | 10 | 1687 | 413 | 262 | n/a | 478 | ||
| Dollars to Photos USED (Non-duplicated count) | 2012 | 92% | $0.51 | $26.51 | $6.12 | $2.43 | n/a | $8.22 | ||
| Dollars to Photos USED (Non-duplicated count) (Wiki Loves Monuments 2013) | 2013 | 100% | $1.50 | $241.40 | $64.30 | $38.01 | n/a | $77.11 | ||
| Input Hours to Photos USED (non-duplicated count) | 2012 | Report count of 2 | ||||||||
| Input Hours to Photos USED (non-duplicated count)(WLM 2013) | 2013 | Report count of 0 | ||||||||
| Good Article Count | 2012 | Not applicable | ||||||||
| Featured Artice Count | 2012 | Not applicable | ||||||||
| Quality Image Count | 2012 | 100% | 0 | 484 | 77.67 | 9 | 0 | 164.04 | ||
| Quality Image Count | 2013 | 100% | 0 | 74 | 11.50 | 1 | 0 | 22.98 | ||
| Valued Image Count | 2012 | 100% | 0 | 27 | 2.50 | 0 | 0 | 7.74 | ||
| Valued Image Count | 2013 | 100% | 0 | 4 | 0.57 | 0 | 0 | 1.28 | ||
| Featured Picture Count | 2012 | 100% | 0 | 17 | 2.67 | 1 | 0 | 5.08 | ||
| Featured Picture Count | 2013 | 100% | 0 | 1 | .07 | 0 | 0 | 0.27 | ||
| 3 Month Retention (Existing Users Wiki Loves Monuments 2012)[25] | 2012 | Retention Rate = 43.5% (22% 5+ Photos in December 2012)[26] | ||||||||
| 3 Month Retention (New Users Wiki Loves Monuments 2012) | 2012 | Retention Rate = 2.5% (0.32% 5+ Photos in December 2012)[27] | ||||||||
| 6 Month Retention (Existing Users Wiki Loves Monuments 2012) | 2012 | Retention Rate = 40.4% (21% 5+ Photos in March 2013) | ||||||||
| 6 Month Retention (New Users Wiki Loves Monuments 2012) | 2012 | Retention Rate = 2.4% (0.26% 5+ Photos in March 2013) | ||||||||
| Percent Experienced Program Leader | 2012 | Report count of 2 | ||||||||
| Percent Developed Brochures and Printed Materials | 2012 | |||||||||
| Percent Blogs or Online Sharing | 2012 | |||||||||
| Percent with Program Guide or Instructions | 2012 | |||||||||
| Percent Experienced Program Leader | 2013 | Report count of 0 | ||||||||
| Percent Developed Brochures and Printed Materials | 2013 | |||||||||
| Percent Blogs or Online Sharing | 2013 | |||||||||
| Percent with Program Guide or Instructions | 2013 | |||||||||
Bubble Graph Data[edit]
Data for Graph 2 & 3. Budget, Participation, and Photos Added.
| Report ID | Year | Budget | Number of Participants | Bubble Size: Number Photos Added |
|---|---|---|---|---|
| 48 | 2012 | $10,000 | 941 | 27,054 |
| 76 | 2012 | $1,920 | 392 | 5,635 |
| 81 | 2012 | $944 | 75 | 2,573 |
| 89 | 2012 | $7,795 | 299 | 2,028 |
| 95 | 2012 | $2,896 | 651 | 32,987 |
| 78 | 2012 | $1,880 | 330 | 4,087 |
| 79 | 2012 | $3,100 | 2,005 | 22,037 |
| 92 | 2012 | $4,735 | 153 | 3,774 |
| 97 | 2012 | $16,995 | 128 | 1,853 |
| 86 | 2012 | $917 | 767 | 10,186 |
| 4 | 2012 | $13,068 | 242 | 7,314 |
| 70 | 2013 | $6,652 | 151 | 4,102 |
| 72 | 2013 | $12,272 | 190 | 11,098 |
| 83 | 2013 | $11,182 | 177 | 7,000 |
| 77 | 2013 | $9,342 | 154 | 4,047 |
| 75 | 2013 | $1,270 | 226 | 2,554 |
| 82 | 2013 | $2,157 | 1,485 | 11,397 |
| 88 | 2013 | $1,150 | 84 | 2,621 |
| 73 | 2013 | $10,890 | 121 | 3,187 |
| 90 | 2013 | $3,041 | 99 | 2,689 |
| 74 | 2013 | $2,414 | 156 | 2,373 |
| 71 | 2013 | $4,129 | 176 | 23,920 |
| 80 | 2013 | $392 | 67 | 1,572 |
| 85 | 2013 | $2,125 | 629 | 6,793 |
| 93 | 2013 | $4,489 | 400 | 23,124 |
| 96 | 2013 | $29,102 | 89 | 6,421 |
Data for Graph 4 & 5. Budget, Photos Added, and Unique Photos Used
| Report ID | Year | Number Photos Added | Budget | Bubble Size: Number Unique Photos Used |
|---|---|---|---|---|
| 47 | 2012 | 6,896 | 416 | |
| 48 | 2012 | 27,054 | $10,000 | 4,812 |
| 76 | 2012 | 5,635 | $1,920 | 1,824 |
| 81 | 2012 | 2,573 | $944 | 885 |
| 89 | 2012 | 2,028 | $7,795 | 459 |
| 95 | 2012 | 32,987 | $2,896 | 1,934 |
| 78 | 2012 | 4,087 | $1,880 | 474 |
| 79 | 2012 | 22,037 | $3,100 | 6,103 |
| 92 | 2012 | 3,774 | $4,735 | 686 |
| 97 | 2012 | 1,853 | $16,995 | 641 |
| 86 | 2012 | 10,186 | $917 | 378 |
| 4 | 2012 | 7,314 | $13,068 | 3,027 |
| 70 | 2013 | 4,102 | $6,652 | 55 |
| 72 | 2013 | 11,098 | $12,272 | 1,125 |
| 83 | 2013 | 7,000 | $11,182 | 52 |
| 77 | 2013 | 4,047 | $9,342 | 160 |
| 75 | 2013 | 2,554 | $1,270 | 595 |
| 82 | 2013 | 11,397 | $2,157 | 374 |
| 88 | 2013 | 2,621 | $1,150 | 11 |
| 73 | 2013 | 3,187 | $10,890 | 532 |
| 90 | 2013 | 2,689 | $3,041 | 80 |
| 74 | 2013 | 2,373 | $2,414 | 10 |
| 71 | 2013 | 23,920 | $4,129 | 702 |
| 80 | 2013 | 1,572 | $392 | 262 |
| 85 | 2013 | 6,793 | $2,125 | 26 |
| 93 | 2013 | 23,124 | $4,489 | 1,687 |
| 96 | 2013 | 6,421 | $29,102 | 527 |
More Data[edit]
Program Inputsː Budgets, Hours, Donations
| Report ID | Program Length( Month) | Budget | Staff Hours | Volunteer Hours | Total Hours | Donated Space | Donated Equipment | Donated Food | Donated Prizes |
|---|---|---|---|---|---|---|---|---|---|
| 47 | 1 month | 200 | 200 | Yes | Yes | Yes | Yes | ||
| 48 | 1 month | $10,000.00 | 100 | 300 | 400 | Yes | Yes | ||
| 76 | 1 month | $1,920.00 | |||||||
| 81 | 1 month | $944.05 | Yes | Yes | |||||
| 89 | 1 month | $7,795.00 | |||||||
| 95 | 1 month | $2,896.03 | |||||||
| 78 | 1 month | $1,880.00 | Yes | Yes | |||||
| 79 | 1 month | $3,100.00 | Yes | Yes | |||||
| 92 | 1 month | $4,735.24 | Yes | Yes | Yes | ||||
| 97 | 1 month | $16,994.74 | Yes | ||||||
| 86 | 1 month | $917.40 | Yes | Yes | Yes | ||||
| 4 | 1 month | $13,068.31 | Yes | Yes | |||||
| 70 | 1 month | $6,652.45 | |||||||
| 72 | 1 month | $12,272.00 | Yes | ||||||
| 83 | 1 month | $11,182.00 | |||||||
| 77 | 1 month | $9,342.00 | Yes | ||||||
| 75 | 1 month | $1,270.00 | |||||||
| 82 | 1 month | $2,157.31 | Yes | ||||||
| 88 | 1 month | $1,150.00 | Yes | ||||||
| 73 | 1 month | $10,890.00 | Yes | Yes | |||||
| 90 | 1 month | $3,040.54 | |||||||
| 74 | 1 month | $2,414.00 | |||||||
| 71 | 1 month | $4,129.00 | Yes | Yes | |||||
| 80 | 1 month | $392.05 | |||||||
| 85 | 1 month | $2,124.76 | Yes | ||||||
| 93 | 1 month | $4,489.17 | |||||||
| 96 | 1 month | $29,101.50 | Yes |
Program Outputsː New User Accounts, Number of Photos/Media Added
| Report ID | Number of Participants | Number NEW User Account Created | Number Photos/Media Added |
|---|---|---|---|
| 47 | 451 | 6896 | |
| 48 | 941 | 941.00 | 27054 |
| 76 | 392 | 5635 | |
| 81 | 75 | 2573 | |
| 89 | 299 | 2028 | |
| 95 | 651 | 32987 | |
| 78 | 330 | 4087 | |
| 79 | 2005 | 22037 | |
| 92 | 153 | 3774 | |
| 97 | 128 | 1853 | |
| 86 | 767 | 10186 | |
| 4 | 242 | 7314 | |
| 70 | 151 | 4102 | |
| 72 | 190 | 11098 | |
| 83 | 177 | 7000 | |
| 77 | 154 | 4047 | |
| 75 | 226 | 2554 | |
| 82 | 1485 | 11397 | |
| 88 | 84 | 2621 | |
| 73 | 121 | 3187 | |
| 90 | 99 | 2689 | |
| 74 | 156 | 2373 | |
| 71 | 176 | 23920 | |
| 80 | 67 | 1572 | |
| 85 | 629 | 6793 | |
| 93 | 400 | 23124 | |
| 96 | 89 | 6421 |
Program Outcomesː Quality Improvement
| Report ID | Number UNIQUE Photos Used | Number Quality Images | Number Valued Images | Number Featured Pictures |
|---|---|---|---|---|
| 47 | 416 | 0 | 0 | 0 |
| 48 | 4812 | 364 | 27 | 8 |
| 76 | 1824 | 2 | 0 | 0 |
| 78 | 474 | 0 | 0 | 0 |
| 79 | 6103 | 28 | 2 | 2 |
| 81 | 885 | 484 | 0 | 17 |
| 86 | 378 | 11 | 0 | 1 |
| 4 | 3027 | 24 | 0 | 2 |
| 89 | 459 | 1 | 0 | 0 |
| 92 | 686 | 9 | 1 | 1 |
| 95 | 1934 | 9 | 0 | 1 |
| 97 | 641 | 0 | 0 | 0 |
| 70 | 55 | 0 | 0 | 0 |
| 71 | 702 | 0 | 0 | 0 |
| 72 | 1125 | 74 | 0 | 0 |
| 73 | 532 | 0 | 0 | 0 |
| 74 | 10 | 0 | 0 | 0 |
| 75 | 595 | 1 | 0 | 0 |
| 77 | 160 | 0 | 0 | 0 |
| 80 | 262 | 6 | 0 | 0 |
| 82 | 374 | 3 | 0 | 0 |
| 83 | 52 | 3 | 3 | 0 |
| 85 | 26 | 0 | 0 | 0 |
| 88 | 11 | 0 | 0 | 0 |
| 90 | 80 | 22 | 1 | 0 |
| 93 | 1687 | 52 | 4 | 1 |
| 96 | 527 | 0 | 0 | 0 |
Notes[edit]
- ↑ (Mean= 9, SD= 4)
- ↑ Averages reported refer to the median response.
- ↑ Mean= 6,340.68, SD= $6,516.49
- ↑ Mean= 394, SD= 456
- ↑ Mean=$40.20, SD=$66.77
- ↑ Note: Although "content production" is a direct product of the program event itself and technically a program output rather than outcome most of the program leaders who participated in the logic modeling session felt this direct product was the target outcome for their programming. To honor this community perspective, we include it as an outcome along with quality improvement and retention of "active" editors.
- ↑ (Mean = 8,864, SD=8,846)
- ↑ (Mean=1929, SD=1948)
- ↑ As of November 4, 2013.
- ↑ (Mean=413, SD=478)
- ↑ (Mean=$1.1, SD=$2.00)
- ↑ (Mean=$6.12, SD=$8.22)
- ↑ Note: This implementer also had the largest budget in 2012 and did not use the full amount so they applied the remaining budget to their 2013 event budget. It is unknown whether the full budget will be allocated to event expenses.
- ↑ Some photos may have been rated in multiple categories.
- ↑ https://www.mediawiki.org/wiki/Analytics/Metric_definitions#Active_editor
- ↑ by counting those who had made 15 or more edits for the three month quarter. However, users could make 15 or more edits during any period of time, not five or more each month necessarily. This solution allows us to even much of the month-to-month variation of users to get at those users who are more or less staying active on the project. For example someone who made five edits in the first month, three edits in the second month, and six edits in the third month following the event would be counted as active for the full three month quarter. At the same time, someone who made all their contributions in the first month following the contest, and nothing further, would also be counted as surviving or active for the quarter.
- ↑ New users were defined as WLM 2012 uploader usernames which had not contributed to commons in the previous year.
- ↑ Encouraging contributors to familiarize themselves with the Illustrating Wikipedia brochure may help address confusion about free content.
- ↑ a b As of November 4, 2013. Image usage numbers will increase over time.
- ↑ Calculated for the 21,223 images used from the 11 WLM 2012 contests for which budget was reported
- ↑ Percentages out of 21 who provided direct report.
- ↑ Percentages out of 21 who provided direct report.
- ↑ Percentages out of 21 who provided direct report.
- ↑ Percentages out of 21 who provided direct report.
- ↑ Wiki Loves Monuments' retention listed refers to both new and existing users; see program-specific reporting for details on retention of new vs existing contributors.
- ↑ Used Wiki Loves Monuments 2012 Overall, not just programs reported; Retention rate for Wiki Loves Monuments 2013 (adding 5+ photos) existing users = 34%.
- ↑ Retention rate for Wiki Loves Monuments 2013 (adding 5+ photos) new users = 2.3%.