
Research:WikiGrok/Test3
Summary[edit]
Engagement & conversion[edit]
Quality[edit]
Test 3: 16% of all users, en.wiki[edit]
Test began: 2015-01-14 011700
Test ended: 2015-01-21 022658
Sampling[edit]
The test targets randomly selected 16% of all users on English Wikipedia on mobile devices with screen width less than 768 pixels. At the start of the test, users are randomly assigned to one of two buckets via a token that persists across sessions (clearing the token resets the bucket assignment). There is a limit of 2 responses per minute from a fixed IP address. The test lasts for 7 days.
Treatments[edit]
Users in the pool of eligible participants see one of two versions of WikiGrok widget when landing on articles where WikiGrok is activated. The start and end of the workflow is identical in the two conditions:
- a landing screen with a call to action that the user needs to accept in order to proceed to the next step
- a form with a WikiGrok question, the design of which depends on the experimental group the user is assigned to
- a confirmation screen, displayed after clicking on the submit button and successfully storing a response (including a "Not sure" or NULL response).
The WikiGrok question is the only element in the workflow that varies across conditions, and it consists of two updated types of questions:
- A binary question for group A
- A tagging task with multiple possible values for group B.
Once a user has completed the WikiGrok workflow for a particular article, they will no longer see WikiGrok on that article in the future. The list of articles that they have completed WikiGrok on is stored in LocalStorage.
Claim selection[edit]
The total number of eligible pages is between 260,000 and 300,000.
- Writer (36444 items)
- Item eligibility: instance of human, occupation writer, not occupation author
- Potential claims: occupation author
- Actor (107047 items)
- Item eligibility: instance of human, occupation actor
- Potential claims: occupation television actor, occupation film actor
- Album (155231 items)
- Item eligibility: instance of album
- Potential claims: instance of live album, instance of studio album
Data QA[edit]
There are data quality challenges that we are working in understanding. The most prominent issue is that some sessions (defined by (userToken, taskToken) pairs) do not include page-impressions while they include widget-impression or there are responses logged in these sessions. On the other hand, there are sessions with more than one occurrence of page-impression in them (and the latter does not explain the missing page-impressions in the former case). For the data analysis reported here, we have removed any session that does not include page-impression.
Results[edit]
Top-Level Statistics[edit]
From the 166,888 pages WikiGrok widget could be enabled on, 7199 unique pages had at least one version (a) played on them (out of 92,855 pages with at least one impression). This number is 9013 for version (b) (out of 93,149 pages with at least one impression). By the end of the test, 6% of these pages had at least one non-null response submitted through them.
The top-level session statistics are as follows:
| sessions with ... | version (a) | version (b) |
|---|---|---|
| page impression | 5,396,306 | 5,397,893 |
| widget impression | 2,960,783 | 2,961,053 |
| response | 13063 | 9790 |
| non-null responses | 13063 | 9790 |
| no-thanks | 150,849 | 151,733 |
| click-accept | 17,906 | 16,185 |
| success impression | 14,824 | 9793 |
The Funnel[edit]
The following graph shows the funnel for the test. Each node of the graph is labeled by the corresponding widget name in MobileWebWikiGrok schema. The numbers in parantheses show the number of times the widget is used, and the numbers on the connecting arcs show the state transition probabilities when available.

Observations
- The percentage of page impressions that result in widget impression is slightly higher in test 3 when compared to test 2. However, the difference is not significant. (54% compared to 50%)
- The percentage of times the user accepts the widget impression is 0.5%, which is comparable to 0.4% in test 2.
- While in test 2 15% of times widget impression resulted in no-thanks, this number is dropped to 5% for test 3 suggesting that the users decide to not interact with WikiGrok. In the current WikiGrok design, it is recommended that the user be removed from the pool of eligible users if the user chooses no-thanks once.
- While 80% of the times a user that had accepted WikiGrok in test 2 submitted a response, this number is dropped to 74% in test 3. Experiments should be designed to increase this number: if a user has made it to accept, the user should continue to be engaged enough to submit a response.
[edit]
Response Analysis[edit]
The operational model behind WikiGrok is not the 1-response, 1-edit model traditionally considered in Wikimedia projects. The idea here is to collect as many responses as needed for each question and make the edit, i.e., push the response to Wikidata, only when the responses meet a certain level of quality or confidence. Before moving into results, it is important to define some terms. For the rest of this document, the following definitions hold.
Quality: For the questions we do not know the ground truth, an aggregated response is considered high quality if the submitted response to Wikidata is not reverted two weeks after the data is written to Wikidata. The aggregated response is considered low quality otherwise.
Percentage agreement with Wikidata: For each question, percentage agreement with Wikidata is the fraction of responses for that question that match the ground truth as available in Wikidata. This measure is defined only when the ground truth exists.
We analyzed responses collected from version (a) and (b). The results of this analysis follows.
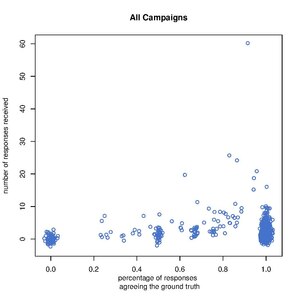
Number of responses vs. Percentage Agreement[edit]
For both versions, we studied the scatter plot of the number of responses collected per question and the percentage agreement in responses with Wikidata responses for each question that has a ground truth response in Wikidata.
-
 version (a)
 -
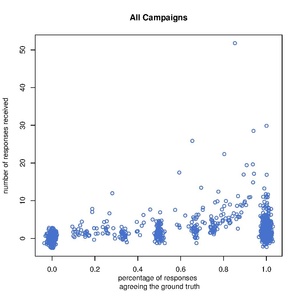 version (b)


There are multiple observations based on the comparison of the two plots:
- Version (a) questions collect more signal from the responses, i.e., more questions in version (a) have 0% or 100% agreement with the ground truth when compared to version (b). This is expected since in version (a) the user's response is one of the following: "yes", "no", "I don't know" while in version (b) the user is shown multiple labels and he/she can choose as many of them at a time as desired. Under this version, if a label is not chosen, we do not know whether it is not chosen because the user thought the label is not applicable (a "no" response in version (a)) or because the user did not know whether the label was applicable ("I don't know" in version (a)).
- For both versions, there is a visible increase in the percentage agreement in responses as the number of responses increases. We need to examine this further: does this mean that the more responses we collect per question, the more agreement with ground truth? If no, can we determine the minimum number of responses needed to assure a certain level of agreement with the ground truth?
- There are more versions (a) questions with 100% response agreements with Wikidata when compared to version (b) even when we normalize for the number of questions responded under each scenario. This can be more easily observed in the following two histograms.
-
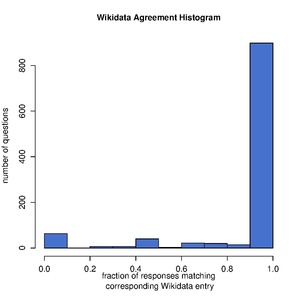 version (a)
 -
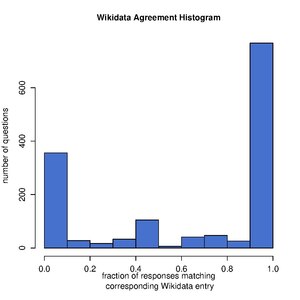 version (b)


Number of Responses and Pass Threshold[edit]
Two variables stand out whenever we try to model many-response to one answer problems. The first one is the number of responses submitted for a question. The second is the pass threshold, i.e., the minimum percentage of "yes" responses required to call the answer to a question "yes". The two and a series of other variables will be used in the following test to build a model that can help us determine which responses should be submitted to Wikidata.
Here, we plot the number of questions accepted under two scenarios. In scenario 1, the only criterion for accepting the answer to a question as "yes" is the number of responses submitted to that question. In scenario 2, the only criterion is the fraction of responses that are "yes".
- Pass Threshold
-
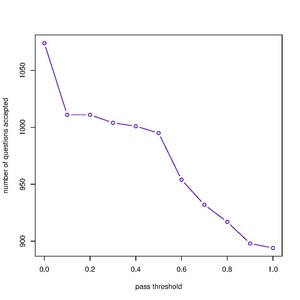 version (a)
 -
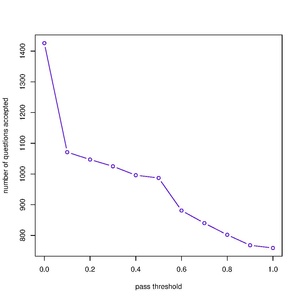 version (b)


- Number of Responses Threshold
-
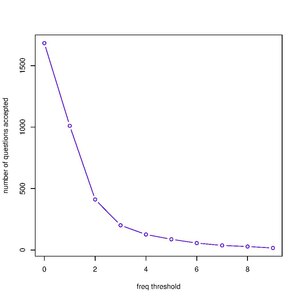 version (a)
 -
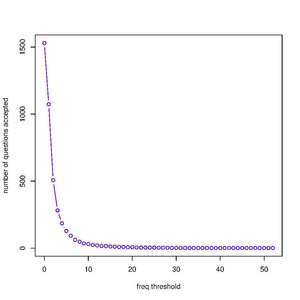 version (b)


Version (a) or (b)?[edit]
Directly comparing version (a) and version (b) results is not accurate since version (a) includes "no" responses while version (b) has mixed "no" and "I don't know" responses. Given the current setting and the information we can extract from the two tests, version (a) does better than version (b).
Logged-in vs Logged-out users[edit]
We looked at the responses from logged-in versus logged-out users. The number of logged-in users participating in the test is very limited. This initial analysis can help us build hypothesis for future tests but cannot help us with fully understanding the difference in the quality of responses submitted by logged-in versus logged-out users.
There are 469 responses from 123 logged-in users, 23 of the users had more than 100 total edits in their edit history. We know the ground truth in 78 instances (out of the total of 469). From those 78 instances, we know 52 of them (78%) matched the ground truth.
There are 32,207 responses from logged-out users. We know the ground truth in 6232 instances. From those instances we know 4459 of them (72%) matched the ground truth.