Research talk:Measuring edit productivity/Work log/2016-01-18
Monday, January 18, 2016[edit]
Hey! Some time to work on this again. So, I wanted to do two things today.
- Break out the productive contributions of bot users and registered users who are using tools (like AWB)
- Get some nice graphs for individual users
So, here's what happens when I break out editors by type and tool.
So, we can learn as little bit by breaking out bots and tool-assisted editing. It looks like both bots and tool-assisted editing grows primarily during the decline phase of Wikipedia (after 2007). With bots, the growth is periodic and seems to decay after 2012 (Wikidata?). Whereas, it seems that the use of tools to assist editing seems to only be growing. Again can see that -- even with tools and bots broken out -- the proportion of productive content added by anons continues to decay relatively steadily. The (maybe) growth in registered editor activity in the spring of 2015 doesn't seem to affect anons in the same way as registered editors. It's also not reflected in bot or tool-assisted activities.
OK. Now for some fun. Let's look at what productivity looks like for a few editors. --Halfak (WMF) (talk) 21:34, 18 January 2016 (UTC)
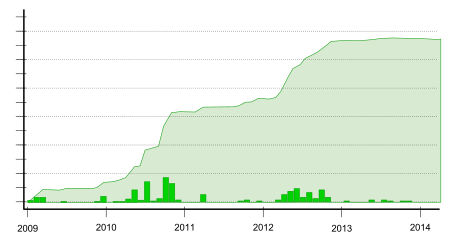
So, for fun, I picked myself User:EpochFail, User:Jimbo Wales and User:DGG (a prolific volunteer and contributor to AFC who I have been speaking with recently). Here's what we get:


So, the bars represent monthly additions of persisting words to articles. The area represents a cumulative total productivity. It's interesting to see how DGG contrasts sharply with User:Jimbo Wales and User:EpochFail (me). DGG's contributions are far more consistent and the result is a linear growth in his cumulative productivity. Wales and I are much more bursty and periodic in our contributions to articles. Again, I feel myself living the limitations of this metric. Around 2010, I started concentrating on tooling for Wikipedia editors and I've been working day and night since to make progress. From the measurement strategy, you'd guess that I'd mostly just left the site! --Halfak (WMF) (talk) 21:56, 18 January 2016 (UTC)
One more fun note. Here's what I thought these graphs would look like over a year ago:


