
Learning and Evaluation/Reporting and Storytelling

The storytelling initiative started with a series of three virtual meet ups. It seeks to help community members make better use of reporting to bring their stories forward, across the movement. If you are a program or project leader, and struggle to get your story across in reporting, this is your chance to learn a few tricks and resources to build a narrative. Through some key strategies you can improve the way you share about your efforts, the impact of the work in advancing the movement, and how others might benefit from your experience.
Storytelling strategies for improved reporting
[edit]
Live Session held on October 15, 1500 UTC. Event page.
- Why do we evaluate and report?
The essence of the movement lays in sharing what we know. At the movement's organization level, this means exchanging knowledge on process, programs and projects, what works and how, to achieve the movement's goals.
In this first issue, we shared how the elements in a report and the elements in a story can compare, drawing a comparison that can help anyone focus. We also shared resources that can be used to capture stories better. Kaarel Vaidla joines to talk about how they approach reporting in Wikimedia Eesti.
Read through the presentation below and watch the video to learn more:
- Resources from the live session
-
Virtual event
-
 Presentation: Storytelling strategies for improved reporting.

Further resources
[edit]Using video to tell a story
[edit]- Case studies of programs and projects that have used video as a format to tell a story
-
Hur tittar du på Wikipedia. Wikimedia Sweden Education video.
-
Wikimedia UK «The GLAM-Wiki Revolution»
-

-
Wiki Loves Monument 2013 in Armenia.
-
Viquimarató Joaquim Folch i Torres by Amical Wikimedia.
-
Wikipedie Komunitní projekt by Wikimedia CZ.
-
Video about how to edit Wikipedia by Alessandro Serravalle.
-
Wikipedia Education program in Ayb High School, Armenia

Example reports and guides shared by communities
[edit]- Program Resources.This page will give a set of resources on setting goals, metrics and tools to measure around the most common Wikimedia programs.
- Learning patterns. Capture your learning processes with a Learning Pattern you can share with the community.
- Wikimedia Estonia's guide to writing a reports and proposals (in English). This guide outlines the best practices developed by the chapter in report and grant proposal writing. (Thanks to Kaarel Vaidla for sharing!)
- Wikimedia Mexico’s guide to writing a report (in Spanish). This guide has very useful information on how and why to write a report, what are the key questions and steps you need to check when writing a report. (Thanks to Iván Martínez for sharing!)
- Chapters Dialogue. This page is a great example of how to organize a report, use visual resources and designing different parts to tell the story.
Infographics and the visual display of information
[edit]

Session held on November 12, 1600 UTC. Event page.
- Why use visualizations?
Information can be very dense and complex. Wikimedia programs are very complex!
Visualization may help your audience to process this information in an easier way, increasing their ability to understand and convey your story to others.
In this second issue, we shared graphic types, what they are used for and steps to making a visualization, proposing what to focus on whether the program or project is ongoing or finished. In this session, Daria Cibulska joined to share how Wikimedia UK used infographics in therir reporting, specially, in the review of Wikimedians in Residence.
Revisit the presentation to find helpful resources, and watch the video to learn more of the conversations that took place.
- Resources from the live session
-
Virtual meet up
-
![Presentation: Infographics and the visual display of information.[1]](//upload.wikimedia.org/wikipedia/commons/thumb/4/4d/Infographics_and_the_visual_display_of_information.pdf/page1-321px-Infographics_and_the_visual_display_of_information.pdf.jpg) Presentation: Infographics and the visual display of information.[1]
Presentation: Infographics and the visual display of information.[1]
![Presentation: Infographics and the visual display of information.[1]](http://upload.wikimedia.org/wikipedia/commons/thumb/4/4d/Infographics_and_the_visual_display_of_information.pdf/page1-321px-Infographics_and_the_visual_display_of_information.pdf.jpg)
Further Resources
[edit]Some Infographics for inspiration
[edit]-

-
 Pie chart made with cheese for the project WikiCheese
 -
 Bar chart made with cheese for the project WikiCheese
 -
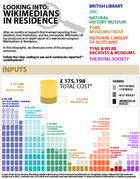 Wikimedians in Residence. Intro an inputs only.
 -
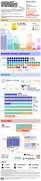 Wikimedians in Residence. Full infographic.
 -
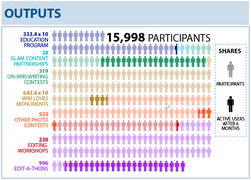 Program Reports (beta) Outputs only.
 -
 Evaluation Reports (beta) Full image.
 -
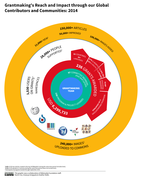 Wikimedia Grantmaking Unvierse.
 -
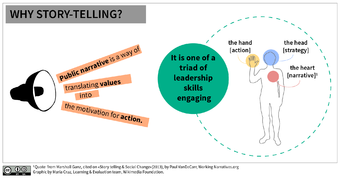 Storytelling and Public Narrative.
 -
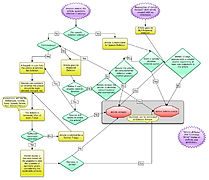 Flowchart of deletion process on English Wikipedia
 -
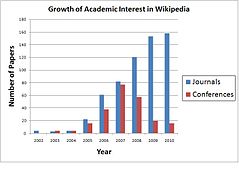 Growth in academic interest on Wikipedia.


_-_OUTPUTS.png)

.jpg)

External catalogs of data visualizations
[edit]Guides to making infographics and useful software
[edit]- Example A: How to differentiate key information from background knowledge.
- User-centered design for free knowledge, presented by Jonathan Morgan, Jessie Wild Sneller and Yana Welinder.
- Infographic icon set: Make your own graphics!
- Inkscape: Open source software to edit vector graphics.
- Wordle.net: An online software to make word clouds.
- Online guide to making an infographic.
Frame your measures to tell the story you want
[edit]
Session held on December 17, 1600 UTC Visit the event page here.
- Why framing?
Wikimedia is a global movement whose mission is to bring free educational content to the world. Through various projects, programs and chapters work, and the support structure of Wikimedia Foundation, Wikimedia strives to bring about a world in which every single human being can freely share in the sum of all knowledge. Framing helps to point out shared interests, highlight relevance to an audience and make clear pathways for support.
In this third issue, we showed how framing can help communities on a local and global level, seeking to inspire through concepts like glocalization and agenda-setting theory. We also shared how a Logic Model can help in this process, and how to talk about failure. Dimitar Dimitrov and Nicola Zeuner, from Wikimedia DE, shared their experience in talking about advocacy in the report.
Revisit the presentations shared during the live session, and watch the video of the virtual meet up.
- Resources from the live session
-
Frame your measures to tell the story you want. Review the virtual event.
-
 Measuring Liquid Lobyying, WMDE's presentation on advocacy planning and reporting.
 -
![Frame your measures to tell the story you want. [2]](//upload.wikimedia.org/wikipedia/commons/thumb/5/54/Frame_your_measures_to_tell_the_story_you_want.pdf/page1-321px-Frame_your_measures_to_tell_the_story_you_want.pdf.jpg) Frame your measures to tell the story you want. [2]
Frame your measures to tell the story you want. [2]

![Frame your measures to tell the story you want. [2]](http://upload.wikimedia.org/wikipedia/commons/thumb/5/54/Frame_your_measures_to_tell_the_story_you_want.pdf/page1-321px-Frame_your_measures_to_tell_the_story_you_want.pdf.jpg)
Workshop: Storytelling strategies for reporting
[edit]In-person workshop held on May 16, at Wikimedia Conference 2015
-
 Story types.
 -
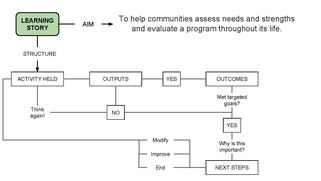 Flowchart for a learning story.
 -
![Storytelling strategies for improved reporting: find the narrative that best suits your program! [3]](//upload.wikimedia.org/wikipedia/commons/thumb/b/b5/Storytelling_strategies_for_improved_reporting_-_Workshop_01.pdf/page1-321px-Storytelling_strategies_for_improved_reporting_-_Workshop_01.pdf.jpg) Storytelling strategies for improved reporting: find the narrative that best suits your program! [3]
Storytelling strategies for improved reporting: find the narrative that best suits your program! [3]


![Storytelling strategies for improved reporting: find the narrative that best suits your program! [3]](http://upload.wikimedia.org/wikipedia/commons/thumb/b/b5/Storytelling_strategies_for_improved_reporting_-_Workshop_01.pdf/page1-321px-Storytelling_strategies_for_improved_reporting_-_Workshop_01.pdf.jpg)
- How can we tell a good story together?
In this in-person workshop, we shared the different story types, grouped according to goals: organize, educate, advocate and learn. While all stories well told are interesting, we focused on the Learning story, with one idea in mind: either if activities go well or not, there is always a lesson to share. Following a flowchart, community members can identify the elements they need to include in the story, according to how the project developed, in order to capture the learning. We provided steps to creating a story:
- Identify story goals
- identify the data you will use
- answer the basic questions (what, how, when)
- capture the learning.
We also asked: what does each step mean to the local context? As the circumstances and framework are key to understanding what communities do on the local level, how they learn and how they put movement goals forward.
At the end of the workshop, participants were asked to work in groups with two example logic models from an education program and a GLAM content donation. Most of them were able to capture the story, understand what data was missing, and what could be done better next time. That is, after all, the whole point of learning.
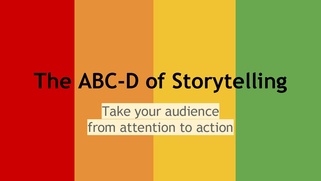
Workshop: the ABCD of Storytelling
[edit]In-person workshop held on July 15, part of Wikimania 2015 pre conference agenda
-
 The ABCD approach
 -
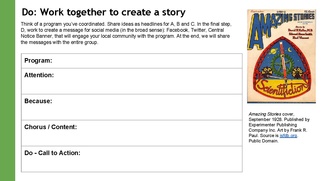 The worksheet used during the workshop
 -
 Full slide deck updated on September 2015


- What steps can you take to create a good story?
In this workshop, we bring together past content developed for the storytelling initiative, under the ABCD frame:
- Attention
- Because
- Chorus (or Content)
- Do: action.
In this workshop, participants learned a few ways to call attention of the audience in the first 7 seconds, like through statistics, stories, quotes or facts. Because refers to why should people get involved with the story, a word that, when introduced, increases cooperation from 60% to 94%. When it comes to Chorus/Content, participants review core ideas, learning stories and how to address local context, which is key to understanding a specific group's work. Finally, in the last step, Do, we practice writing specific calls to action, and expressing how the audience should get involved.
The workshop also integrates the technic of Fail Fest, to create a context in which participants are comfortable speaking about things that didn't work out as planned.
With the help of a worksheet, participants of the workshop can apply this concepts and practice with their own work in mind. All through the workshop, people are encouraged to share their stories and ideas as we go over each step.
Storytelling Toolkit
[edit]The Storytelling Toolkit is a resource that guides program leaders to better tell the story of their program through resources like questions, knowledge shared by others through Learning Patterns and Case studies, and a special section on data visualization.