Research talk:Reading time/Work log/2018-10-18
Add topicThursday, October 18, 2018
[edit]Wrapping up model selection.
[edit]On Tuesday I observed that a | Lomax distribution is a two parameter distribution that fits the page visible lengths at least as well as any other distribution we have tried so far. Lomax is a 2 parameter power law distribution. Based on my reading of Michael Mitzenmacher's paper on power laws, the most likely explanation for this is that the data are generated by a mixture of log normal distributions.
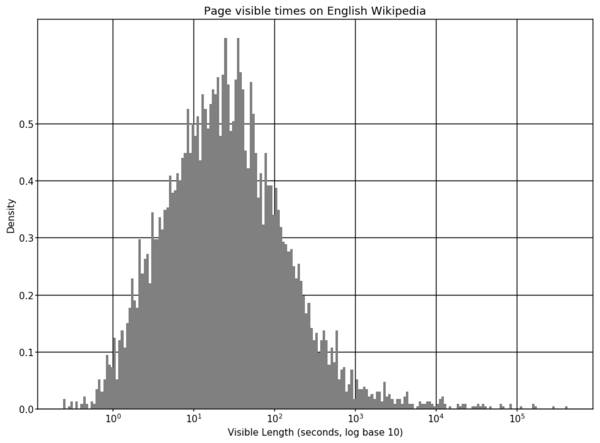
This is consistent with our intuition that there may be (at least) two different processes generating these measurements. One process is someone who reads articles in their browser and then switches away from or closes the tab when they are done reading. In the second process they leave the page open for some time after they have stopped reading and the tab remains visible for some time until they close it. Looking at the data, it appears that we do indeed have a mixture of log normals. However, instead of a distribution with 2 modes it looks like we have 3 modes.

The leftmost mode are events where the page is open for a very short time. These might be "quick backs" where someone opens a page and then immediately realizes they do not want the page open and the navigate away. The vast majority of the density is around the central mode. I created a new set of goodness-of-fit plots where the X-axis is scaled to try and see how well models are fitting the central mode.
|
|
|
Conclusions
[edit]Comparing reading times: Given the results of the model selection process I recommend using T-tests on logged data to detect differences in means. This is the primary metric for comparing reading times. This also supports using least squares estimation on logged data for estimating regression models. The fact that the Lomax model fits the data better than the lognormal model brings a caveat that these models will underestimate the probability of long page dwell times. However, this should not be a very concerning threat compared to the assumption that we are measuring reading behavior.
Ageing and Hazard functions: Since the ordinary Weibull model is such a poor fit for the data, I do not recommend making decisions based on the interpretation of as indicative of positive or negative ageing. The fits of the Exponentiated Weibull model indicate that ageing is often non-monotonic, which contradicts the assumptions of the Weibull model. I recommend that future work seeking to measure changes in ageing patterns interpret hazard function and survival plots of Exponentiated Weibull Models. Uncertainty may be estimated using bootstrapping or MCMC.
The Weibull plot above may not be totally clear (e.g. QQ plot is malformed). Here's the unlogged version:
Multi-model distribution: The relative goodness of the Lomax model compared to the lognormal model is probably due to multi-modality in the data. A mixture of lognormals or a lognormal - pareto mixture might fit the data quite well. Future work might attempt to correct bias in single-mode models by fitting mixture models.
Next steps
[edit]I will switch to multivariate analysis of page visible time. We have a good justification for using OLS regressions on the log of page visible times, which will make fitting models very convenient. I'm going to build variables we are likely to use and do some work to justify rationales for the hypotheses that we can test.


