
Community Insights/2018 Report/Contributors
The Contributors team within the Audiences department works on extending and improving tools for editing, collaboration, and communication, as well as related infrastructure such as parsing. They exist to support new and existing editors across desktop, tablet, and phone platforms.
In the survey, the Contributors team would like to answer the following questions:
- What are the changes of diversity of participants on the Wikimedia projects?
- What are the changes to community attitudes towards contributing to the Wikimedia movement?
- What is the change to community perceptions related to software that supports conversations between Wikimedians?
Limitations
[edit]In this report we summarize some demographic characteristics of Wikimedia contributors. In doing so, we used a stratified sample to reach a diverse group of contributors across the movement. We applied weights to the data using the population of Wikimedia contributors in each project. A limitation of this approach is that we are unable to weigh the data based using known population demographics, which would be the ideal approach. With 3,734 respondents, our overall margin of error is 2%.
The data suggest some general trends of demographics, and while they might not be able to fully represent the entirety of the population, they can help us determine where changes may exist.
Results
[edit]1. What are the changes of diversity of participants on the Wikimedia projects?
[edit]Between 2017 an 2018, no statistically significant changes were found in gender for all contributors. However, a decrease in the proportion of women in emerging communities was detected (ED15). The majority of contributors who reported their gender were male (90%). Under 10% of participants identified as female (8.8%) and 1% reported a non-binary gender. This is similar to the gender makeup reported last year, where 89.5% of contributors identified as male and 9.3% identified as female. Evaluating gender using large regional classifications suggest that there was a significant drop in female contributors between 2017 (11.3%) and 2018 (7.3%) for Emerging countries, but not for Global North countries.[1] When examining across the regional language groups of Wikipedias, as was done in 2017, the median proportion of contributors who reported identifying as female was 9.8% across language groups.[2] The highest proportion was 13.6% (English) and the lowest was 5.2% (Ibero: Spanish/Portuguese). The sample size for English Wikipedia was very small at 88 respondents.
-
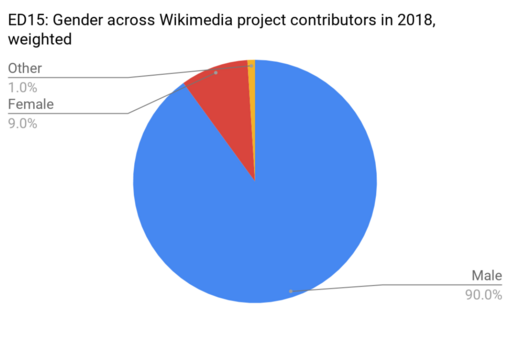 ED15 - Overall Gender on the Wikimedia Projects
 -
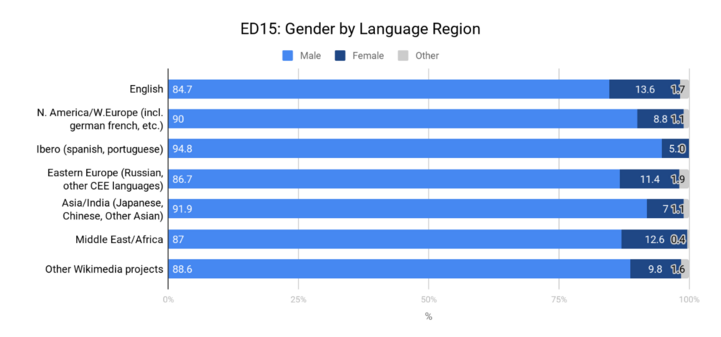 Gender by language project groups


The median age of all contributors is between 35 to 44 years and has slightly increased since 2017 (ED17). High-activity contributors were on average older, between 34–44 and 45–54, than low-activity contributors, who fell between 25–34 and 35–44 years old.[3] The age of contributors increased slightly from 2017[4] to 2018.[5][6] When split by editor activity level, only high-activity contributors showed a significant increase in age year over year (2018 mean = 4.21, 2017 = mean 4.05).[7]
-
 ED15: Age of contributors by activity level

Contributors were overwhelming from the Global North (81.1%). This represents a significant increase compared to 2017 (64%), though this change may be due to sampling changes.[8] This drop in contributors from emerging countries was seen across high-activity and low-activity groups. This change may be due to a change in our sampling strategy. We did not sample contributors who primarily contribute in different languages, but who also contribute in English. Further investigation is needed.
The largest proportion of contributors reside in Western Europe (48.8%), while the smallest groups were from Oceania (0.8%) and Africa (0.7%). Year-over-year changes were examined separately for high-activity and low-activity editors. Among low-activity editors, significant changes were found for Africa, Asia, South-East Asia, North America, South America, Western Europe, and Oceania. For high-activity editors, significant changes were detected for contributors from Africa, Asia, North America, South America, Eastern Europe, Western Europe, and Oceania.

-
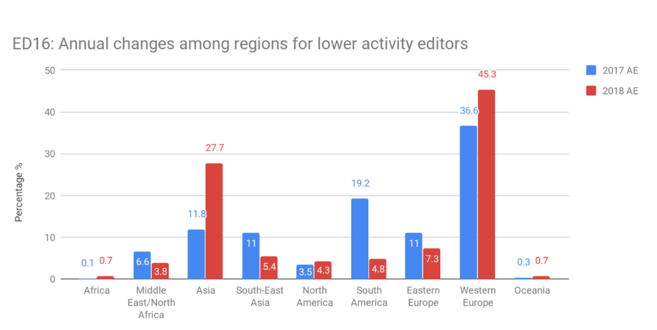 ED16:Changes in region for low activity contributors
 -
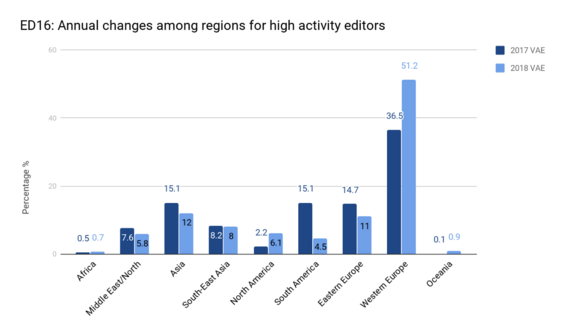 ED16: Changes in region for high activity contributors


85% of contributors have post-secondary education (ED20). There were small, but significant differences between contributors of different activity levels. On average, high-activity contributors reported higher educational attainment than lower activity contributors [9] This is the first year this question was asked in CE Insights, so annual changes are not available.
-
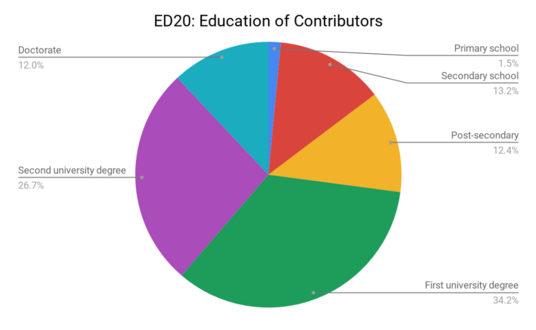 ED20: Education level of Wikimedia contributors

2. What are the changes to community attitudes towards contributing to the Wikimedia movement?
[edit]Three-quarters (75.7%) of participants reported being Satisfied or Very Satisfied with the software they use to contribute to Wikimedia projects, with a slight increase in reported satisfaction from 2017 (ED05). The average response was 3.85 (between "Neither Agree or Disagree" and "Agree"). When separated by activity level, high-activity editors reported small, but significantly higher satisfaction than their lower activity editor counterparts. Participants this year also reported being slightly more satisfied compared to last year (72.7% satisfied or very satisfied). Respondents in the Global South and Global North were equally satisfied with the software used.

81% of contributors agreed or strongly agreed that they found their activities on Wikipedia satisfying and enjoyable (ED21). In general, there seems to be a trend that with higher activity levels, editors reported Wikipedia being more satisfying and enjoyable. Small but significant differences were found between contributors of different activity levels, with high-activity contributors reporting a greater satisfaction (mean = 4; "Agree") than lower activity contributors (mean = 3.94; between "Neither Agree Nor Disagree" and "Agree"). When dividing editors into six groups of activities, rather than just two (high and low), higher activity groups reported higher agreement than lower activity groups. [10] Given the small effect sizes, these differences should be interpreted with caution. This was the first year this question was asked.

Half of the contributors sampled either agreed or strongly agreed that if they stop making their contributions, the things that they're doing will not get done in a reasonable time (ED21). With increasing contributions, editors are more likely to feel this way. The average response was 3.4 (falling between "Neither Agree or Disagree" and "Agree"; Median = 3; "Neither Agree or Disagree"). Investigation of the differences between contributors of different activity levels found small, but significant differences between select contributor groups. Significant differences were found between contributors of different activity levels, with high-activity contributors reporting a higher score (mean = 3.53; between "Neither Agree Nor Disagree" and "Agree") than lower activity contributors (mean = 3.32; between "Neither Agree Nor Disagree" and "Agree"). When dividing editors into six groups of activities, rather than just two, higher activity groups reported higher agreement than lower activity groups.[11] Given the very small effect sizes, these differences should be interpreted with caution. This was the first year this question was asked.

3. What is the change to community perceptions related to software that supports conversations between Wikimedians?
[edit]Compared with other activities, contributors rated both software used for communicating with one or two contributors as well as software used for communicating in large groups as less important (ED06c & ED06d). The mean importance across all the software activities (ED06 & ED07) was 3.38. The mean for communicating with one or two contributors was 3.32. Software for holding large conversations has a mean importance of 3.26.[12] These differences were small but statistically significant.


Most contributors (71.5%) are "Satisfied" or "Very Satisfied" with the tools they use to communicate with one or two other contributors (ED07). About half of contributors (54.2%) report being "Satisfied" or "Very Satisfied" with the tools used to communicate with large groups. Compared with other activities, contributors were more satisfied with the software used to communicate with one or two others contributors and were less satisfied with software used to hold large discussions. (ED07c & ED07d).
The mean tool satisfaction across all the tools rated was 3.83. For tools used to communicate with one or two others, the mean was 3.83. The mean for tools used to hold large, formal discussions was 3.46.[13]


Most useful results
[edit](Forthcoming)
Next steps
[edit](Forthcoming)
Notes
[edit]- ↑ Proportions reported, statistically significant, p < .001, effect size is small, .15
- ↑ For weighting purposes, we combine Wikipedia languages into regions. The groups are: English, Ibero (Spanish & Portuguese), N. America/Western Europe (German, French, Italian, Russian, other Western Europe Wikipedias), Eastern Europe (Russian, Other European Wikipedias), Middle East/Africa (Arabic, other middle east or African languages), Asia/India (Chinese, Japanese, Other Asian Wikipedias), Other Wikimedia Projects includes Commons, Wikidata and a sampling of the rest of the projects.
- ↑ Mean for very active contributors was 3.2 and Mean for low activity contributors was 2.9; statistically significant, p < .001, effect size is small, .10
- ↑ Mean = 3.97; falling between 34-44 and 45-54
- ↑ Mean = 4; falling between 34-44 and 45-54
- ↑ Means reported, statistically significant, p = .005, effect size is small, .02
- ↑ Means reported, statistically significant, p < .001, effect size is small, .04
- ↑ Proportions reported, statistically significant, p < .001, effect size is small, .19
- ↑ Mean for high activity editors was 4.14 and Mean for low activity editors was 3.99; statistically significant, p < .001, effect size is small, .12
- ↑ During sampling, usernames were divided into 6 groups based on the contribution history of the editor. Group 1 had the fewest number of edits over the last 6 months and Group 6 had the highest number of edits. Differences between these groups were similar to differences between high activity and low activity groups. The average response of edit group 2 (Mean = 3.96; between Neither Agree Nor Disagree and Agree) was significantly lower than edit group 6 (4.09; between Agree and Strongly Agree) ( Z = 2.430, N=1092, P =.015). The average response of edit group 3 (Mean = 3.93; between Neither Agree Nor Disagree and Agree) was significantly lower than edit group 5 (Mean = 4.03; between Agree and Strongly Agree) (Z = 2.525, N=1267, P < .010) and edit group 6 (Mean = 4.09; between Agree and Strongly Agree) (Z = 4.481, N=1397, P < .001).
- ↑ The average response of edit group 2 (Mean = 3.32; between Neither Agree Nor Disagree and Agree) was significantly lower than edit group 5 (Mean = 3.50; between Neither Agree Nor Disagree and Agree) ( Z=2.905, N=859, P =.004) and edit group 6 (Mean = 3.61; between Neither Agree Nor Disagree and Agree) Z = 4.605, N=994, P < .001. The average response of edit group 3 (Mean = 3.32; between Neither Agree Nor Disagree and Agree) was significantly lower than edit group 4 (Mean = 3.44; between Neither Agree Nor Disagree and Agree) Z = 1.990, N=978, P < .046), edit group 5 (Mean = 3.50; between Neither Agree Nor Disagree and Agree) Z = 3.360, N=1126, P < .001, and edit group 6 (3.61; between Neither Agree Nor Disagree and Agree) Z = 5.448, N=1261, P < .001). Edit group 4 was significantly lower than edit group 6 (Mean = 3.61; between Neither Agree Nor Disagree and Agree) Z = 2.589, N=1015, P = .009.
- ↑ All on a scale of 5
- ↑ Means reported, statistically significant, p < .001, effect size is medium, .30