
Research:Article feedback/Stage 2/Volume
| Article Feedback v5 | Data & Metrics | Stage 1: Design (December 2011 - March 2012) |
Stage 2: Placement (March 2012 - April 2012) |
Stage 3: Impact on engagement (April 2012 - May 2012) |
|
WP:AFT5 (Talk) Dashboards |
Volume analysis |
Conversions and newcomer quality Final tests Quality assessment |
Overview
[edit]The purpose of the present analysis is to understand to what extent the placement of the AFT form and the display of a prominent link affect the volume of feedback collected.
Sample
[edit]We collected feedback data from the same random set of articles of the English Wikipedia used in Stage 1. The data spans two weeks from April 5, 2012[1] to April 19, 2012 (the end of Stage 2).
Methods
[edit]We consider different placements and feedback links as "treatments" applied to the same set of articles. We build series of daily snapshots for each treatment and use statistical tests to assess whether the difference between the means of these series is significant. We use a t-test when comparing differences between two treatments and one-way analysis of variance when comparing jointly the differences of multiple treatments. Pairwise differences for treatments from the ANOVA are then assessed via Tukey's range test. Significance levels in what follows are represented as (*), (**) or (***) for p-values smaller than .05, .01 and .001 respectively. Unless otherwise stated all analyses are based on time series spanning the entire observation period from April 5 to April 19, 2012.
Results
[edit]Overall volume
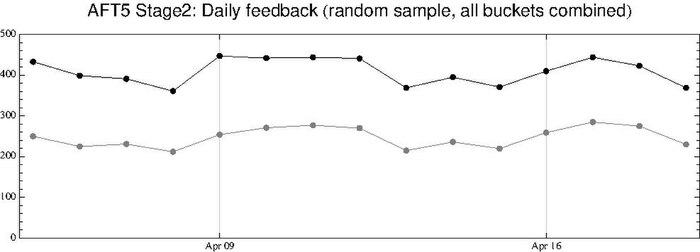
[edit]Over the 15 days of Stage 2 we collected a total of 6,139 pieces of feedback, 3,710 of which (60%) included text. The plot below represents the volume of feedback collected daily (darker line), along with the portion of feedback including text (lighter line) from the AFT random sample.
Volume of feedback by experimental condition
[edit]We collected feedback in three different experimental conditions to measure the effects of the prominence and placement of the AFT form:
- 1A (green)
- feedback link in the tagline + form at the bottom of the article
- 1E (red)
- fixed-position feedback link + form at the bottom of the article
- 1X (orange)
- form at the bottom at the article only
The timeline below shows a substantially larger amount of feedback with text posted by users in condition 1E than in the other two conditions.

During the 15 days of Stage 2, conditions 1A, 1E and 1X generated 967, 1,851 and 892 posts with text respectively (see barchart below). The boxplot below represents the distribution of daily feedback with text by experimental condition. 1E generated twice as much feedback as each of the other two options, the difference is significant (***) while the difference between 1A and 1X is not.


Volume of feedback by origin
[edit]The plots above consider feedback collected in each experimental condition in aggregate. We can break down feedback collected in each of these conditions as a function of its origin, i.e. measure the proportion of feedback posted via a prominent link (opening the AFT form in an overlay) or using the form at the bottom of the article.
The boxplot below compares the daily distribution of feedback originating from the prominent link in 1A and 1E, plotted against the 1X control (bottom widget only). During Stage 2, feedback links in 1A and 1E generated respectively 69 and 963 posts with text, or 7% and 52% of the total feedback in their conditions. The difference between 1A (overlay) and 1E (overlay) is significant (***) and so is the one between 1A and the control (***). 1E (overlay) and 1X didn't produce a significantly different volume of posts. In other words, if we were to test option 1E with a feedback link only (no widget at the bottom of the article), this would produce a volume of feedback comparable to the control condition 1X, however it's likely that this feedback would originate from a different set of users, as indicated by the quality assessment.

The boxplot below compares the daily distribution of feedback originating from the bottom-positioned widget in 1A and 1E, plotted against the 1X control (bottom widget only). During Stage 2, the bottom-position widget in 1A and 1E generated a nearly identical volume of feedback with text: 898 and 888 posts. However, this volume represents very different proportions of the overall feedback collected in each condition: 93% and 48% respectively. The differences between 1A (bottom), 1E (bottom) and 1X (bottom) are not significant.

Notes
[edit]- ↑ The cut-off date was chosen because of a critical fix that was deployed on April 4 to include an af_experiment field in the table and store bucket information with each record.