
Community Insights/Community Insights 2023 Report
Community Insights 2022 Report[edit]
From June 2022 through September 2022, the Global Data & Insights team collected data from more than 3000 Wikimedians from all over the world through the Community Insights survey. These data help paint a picture of our Movement's demographics and communities' social and technical experiences. They also tell us whether we are progressing towards the 2030 Strategic Direction and help to guide the Foundation in better understanding how to support Wikimedia volunteers across roles.
This data is graciously provided by our committed communities, who keep the Wikimedia projects alive, and provide free knowledge to the world.
Key Insights from the 2022 data[edit]

On-wiki Administrators face distinct challenges within the Wikimedia ecosystem, and provide unique insights into the community.
- On-wiki Admins were more likely to have felt unsafe or uncomfortable contributing on-wiki and to have experienced harassment compared to other contributors in 2022. While three in four knew where to get help if they are harassed on-wiki, slightly over half agreed they would get the support they need. They were no more or less likely than other contributors to feel satisfied with enforcement of user conduct policies on their projects.
- Those residing in Emerging Wikimedia Foundation regions were less likely to agree they have the resources they need to address challenges in their roles compared to those in other regions, indicating a need for unique forms of support to admins from Emerging communities.
- Admins were most polarized among contributor types on whether the Wikimedia Foundation communicates well about their projects and initiatives, showing space for improvement for the Foundation in engaging administrators in their unique roles within the Wikimedia ecosystem.
- As the Wikimedia Foundation enters the 2023-2024 fiscal year, this year's Annual Plan focuses on the community health and infrastructural capacity of established editors, including those serving in administrative roles.

We are making some gains in representation towards knowledge equity, and still lagging behind in others.
- The proportion of gender-diverse[1] editors has doubled since 2019, the youngest age group of contributors grew in size to better reflect the global age distribution, and respondents identifying as ethnic minorities within their country of residence are proportional to global estimates.
- However, women are still markedly underrepresented in our Movement, and as are Black and Hispanic/Latino/a/x contributors from the United States and Asian or Asian British and Black and Black British contributors from the United Kingdom.
- In the 2023-2024 fiscal year, the Wikimedia Foundation continues to prioritize Knowledge Equity and Safety & Inclusion to support a global movement where anyone can join us.

Across roles, regions, and identities, Wikimedians are committed to the movement for free knowledge.
- A large majority felt they belong in the Wikimedia movement, that it is are a great place to contribute, that they take pride in contributing, that they are inspired by the vision to share freely in the sum of all knowledge, and that they expect to be contributing in 2 years.
- These data remind us that, across all of our individual differences and challenges we face in a world increasingly marked threats to free knowledge, we share common goals and a vision for a world of free knowledge accessible to everyone and shared by anyone.
Demographics[edit]
One of the roles of the Community Insights survey is to estimate the demographics of active editors in the absence of a census. We do this to understand how the makeup of our Movement changes over time, and how it represents or underrepresents the wide diversity of the globe. This data informs whether the Wikimedia Movement is progressing towards goals such as the 2030 Strategic Direction towards Knowledge Equity and measuring Knowledge Gaps across our movement ecosystem.
Key findings:
- The proportion of gender-diverse active editors has doubled from 2019 to 2022, while proportions of men and women have remained largely unchanged
- Newcomers are more likely to identify as women and with a gender-diverse identity
- Organizers are more likely to identify as women than those in other roles
- The youngest age group (18-24) of contributors grew in size from 14% in 2020 to 20% in 2022
- For the first time, we asked respondents whether they belong to an ethnic minority or discriminated group in their country of residence. Approximately one in five contributors identified as belonging to a discriminated group, while one in ten identified as belonging to an ethnic minority group
Gender[edit]
The proportion of gender diverse active editors has doubled from 2019 to 2022, while the gender proportions of men and women active editors have stayed similar across 2019, 2020, and 2022, with a statistically significant increase of women active editors since 2019 (see Figure 1). There was a small decrease in the number of women from 2020 to 2022, but the difference was not statistically significant.
-
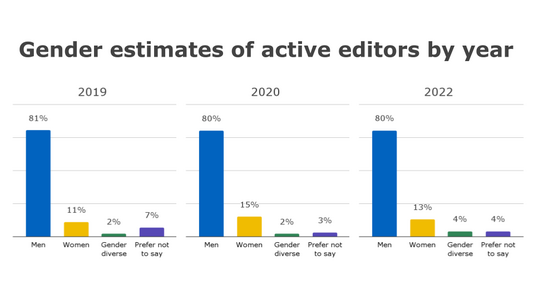 Figure 1. Gender distribution of active editors by year.
Totals may add up to over 100% as the categories for men and women are inclusive of gender diverse respondents.

Although women are still markedly underrepresented among active editors overall[2], among newcomers – editors who started contributing in 2021 or later – 20% identified as women, while 7% were categorized as gender diverse (see Figure 2).
-
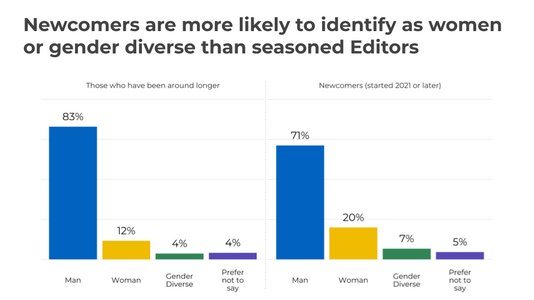 Figure 2. Gender distribution of active editors by tenure.

We also found that roles within the Wikimedia Movement are gendered. Compared to Editors (13%), Admins were less likely to identify as women (7%) while Organizers were more likely to do so (30%).[3] However, from our data we cannot infer that Editors, Admins, or Organizers overall are more or less likely to identify with a gender diverse identity compared to each other: 4% of Editors and 3% of Admins and Organizers in our sample identified with a trans or nonbinary gender identity, but differences between roles were not statistically significant.
Age[edit]
The age groups of active editors broadly reflect the global population distribution (see Figure 3). As the Community Insights survey does not survey editors under the age of 18, we may be underestimating the youngest age group in relation to the global age category. While we cannot know for certain, based on eligibility screening for the survey, we can estimate that 5 to 7 percent of active editors are under age 18 and are not included in the following data.
-
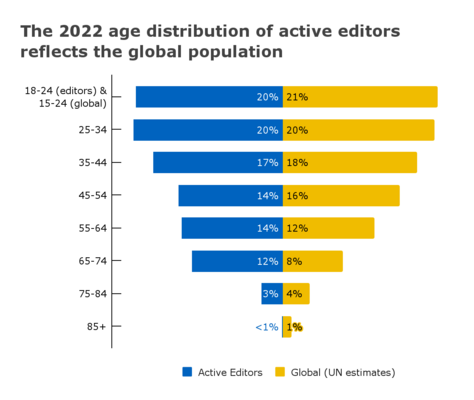 Figure 3. Age distribution of active editors compared to global population estimates.

Comparing 2020 to 2022 data, the youngest age group (18-24) increased from 14% of the distribution in 2020 to 20% of the distribution in 2022. The proportion of editors aged 45-54 decreased from 16% in 2020 to 14% in 2022[4].
Education[edit]
-
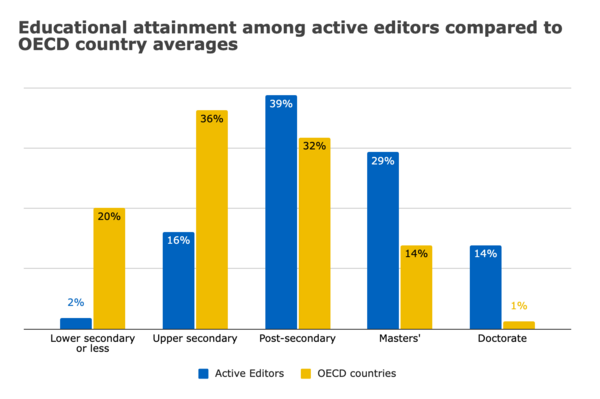 Figure 4. Educational attainment of active editors compared to OECD countries.

Active editors are highly educated: 82% have completed a post-secondary degree or higher, with 43% holding a postgraduate degree such as a Masters’ or Doctorate (see Figure 4). Although no global dataset for educational attainment exists, as a point of comparison we can look to the OECD countries’ 2021 education data: 47% of adults in OECD countries have attained a post-secondary degree or higher, with 14% holding a Masters’ or equivalent, and only 1% holding a Doctorate or equivalent[5]. Active editors were nearly twice as likely to have completed post-secondary education compared to populations of OECD countries.
Ethnic minority group belonging and discriminated group belonging[edit]
For the first time, we piloted two questions about ethnic minority status and discriminated group belonging, adapted from the European Social Survey questionnaire. From this data, we estimate that 12% of active editors identify as belonging to an ethnic minority group in their country of residence, while another 6% were unsure about whether they do; this falls within the UN OHCHR’s estimate that 10-20% of the world’s population belongs to an ethnic minority group[6]. One fifth (21%) of active editors identified as belonging to a discriminated group in their country of residence, and another 7% were unsure about whether they do.
-
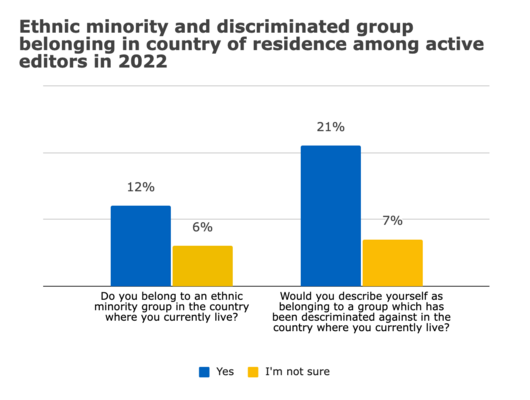 Figure 5. Ethnic minority and discriminated group belonging in country of residence among active editors.

Our interest in these questions was to better understand the broad diversity of experiences within the Wikimedia Movement across linguistic and regional cultures, and to be able to look at whether individual experiences of group belonging in respondents’ countries correlate with on-wiki experiences. We aimed to do this without asking for too much identifying information about community members, and attempted to ask questions which can be applied broadly across social contexts. Of course, not all of these concepts are relevant to every culture or language; we attempted to leave space for respondents to fill in their own experiences and especially to provide feedback for how we can improve questions for places and languages where these pilot questions simply do not make sense to capture peoples' lived experiences. We will be looking closely at the feedback provided by respondents to better understand whether and how we can improve these questions in the future, and we thank everyone who participated.
Race and Ethnicity in the US and UK[edit]
In 2022, we asked contributors in the United States and United Kingdom about their race and ethnicity for a second time.
-
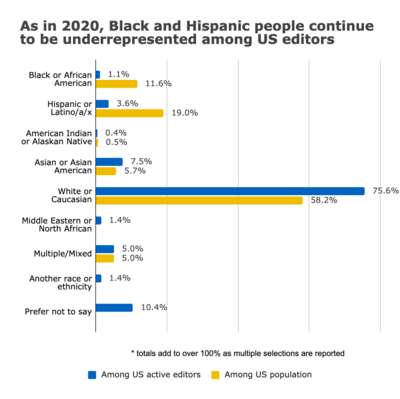 Figure 6. Race and ethnicity among US-based respondents to the Community Insights 2022 survey compared to US population estimates from the US Census 2021 American Community Surveys (ACS). Note that totals add to over 100% in the Community Insights data as those who selected multiple identity categories are included in each data point.
 -
 Figure 7. Race and ethnicity among UK-based respondents to the Community Insights 2022 survey compared to UK population estimates from the UK 2021 Census. Note that totals add to over 100% in the Community Insights data as those who selected multiple identity categories are included in each data point.


In the United States, Black and Hispanic contributors continued to be severely underrepresented among active editors compared to the US population (based on the 2021 American Community Survey conducted by the US Census Bureau[7]).
In the UK, Black or Black British and Asian or Asian British people likewise continued to be underrepresented compared to the UK population (based on the UK 2021 census[8]).
Awareness and Affinity with the Wikimedia Movement[edit]
As a reminder, this data was collected from June 2022 through September 2022, and thus reflects a snapshot of editor sentiments in that time period.
Key findings:
- The percentage of Wikimedians who agreed that the Wikimedia Foundation communicates well about its projects and initiatives has increased steadily, from 29% in 2019 to 38% agreement in 2022.
- 56% of contributors agreed that the Wikimedia Foundation has the right programs and strategies to support the 2030 goal of “becoming the central infrastructure of free knowledge, where anyone will be able to join us”, an increase from 52% in 2020.
- Three in five contributors (59%) agreed that they are confident in the Wikimedia Foundation’s ability to support the global movement.
- Contributors shared a high level of agreement to engagement indicators about the extent they identify with, are inspired by, and promote being a part of the Wikimedia movement and its projects. A large majority of respondents agreed across all items, ranging from 77% to 86%.
- Contributors agreed most that they belong (68%) and feel respected in the Wikimedia movement (56%).
- Contributors were more likely to agree that their voice is heard in decisions made in their community or communities (43%) than in the broader Wikimedia movement (29%).
The Wikimedia Foundation[edit]
Communication from the Wikimedia Foundation[edit]
The percentage of Wikimedians who agreed that the Wikimedia Foundation communicates well about its projects and initiatives has increased steadily since 2019, when only 26% of contributors agreed. This increased to 34% in 2020, and again to 38% in 2022[9].
-
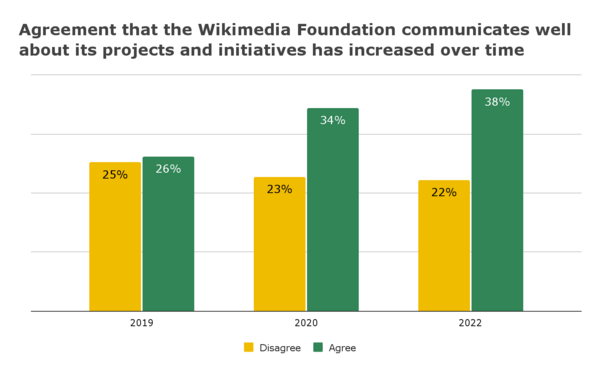 Figure 8. Percent of respondents who agreed and disagreed that the Wikimedia Foundation communicates well about its projects and initiatives by year.

Among the three role types, Admins were most polarized on this question in 2022, with 39% agreeing and 34% disagreeing that the Foundation communicates well, while Organizers were most likely to agree (57%)[10].
We also saw differences between the grouped Wikimedia regions[11], where those from Established regions were less likely to agree on this question (30%) compared to those from Developing regions (47%) and Emerging regions (52%)[12]. Among those in Emerging regions, agreement has increased substantially over time, from 29% in 2019, and again from 43% in 2020[13]. Agreement among those in Established regions also increased from 21% in 2019 to 29% in 2020 and 30% in 2022[14].
-
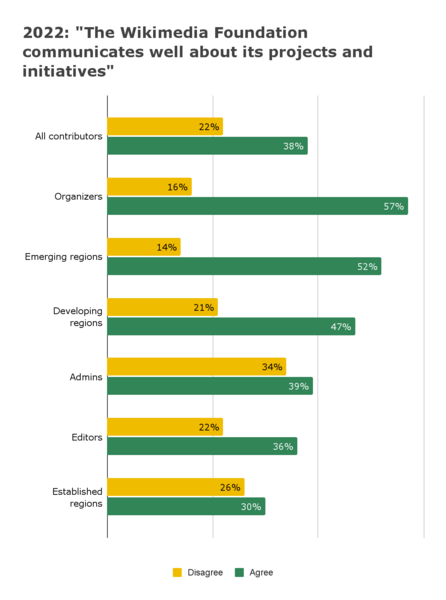 Figure 9. Percent of respondents who agreed and disagreed that the Wikimedia Foundation communicates well, among role types and regions.

In general, we see this question as both indicating room for improvement for the Foundation, while also demonstrating measured progress over time in communicating with a multifaceted global Movement. We caution that this question is purposefully broad in order to understand a general sentiment across contributors, and thus it cannot distinguish between sentiments about how the Foundation communicates and what the Foundation communicates. We likewise cannot understand from this one question why these responses vary by role and region, and suggest more research with specific groups and communities to better understand how to improve communication, as well as what is being done well.
Confidence in the Wikimedia Foundation[edit]
Overall, 56% of contributors agreed that the Wikimedia Foundation has the right programs and strategies to support the 2030 goal* of “becoming the central infrastructure of free knowledge, where anyone will be able to join us”, an increase from 52% in 2020[15]. Each grouped Wikimedia region was statistically significantly different from others in 2022, with those from Developing regions (61%) more likely to agree compared to those from Established regions (49%), and those from Emerging regions (72%) more likely to agree compared to both those from Developing and Established regions[16].
Three in five (59%) agreed that they are confident in the Wikimedia Foundation’s ability to support the global movement, with no change since 2020. Those from Emerging regions (68%) were more likely to agree on this statement compared to those from Developing (61%) and Established (57%) regions[17].
-
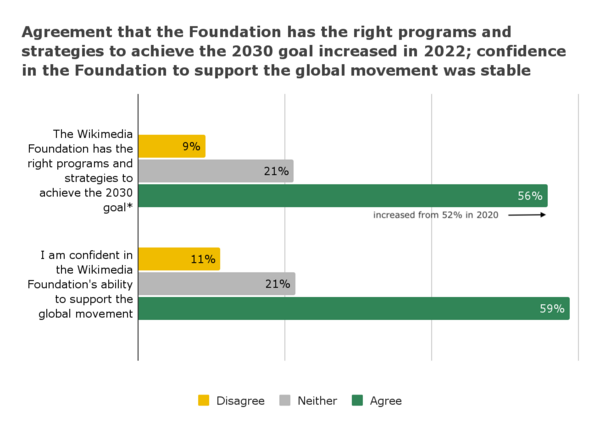 Figure 10. *The 2030 goal referenced in the survey question: "By 2030, Wikimedia will become the essential infrastructure of the ecosystem of free knowledge, and anyone who shares our vision will be able to join us."

Contributor Engagement[edit]
Four statement scales are used to consider engagement among active editors:
- I would recommend Wikimedia projects as a great place to contribute.
- The Wikimedia vision is to freely share in the sum of all knowledge. This vision inspires me to contribute more to Wikimedia projects than I would somewhere else.
- I take pride in contributing to the Wikimedia projects.
- I expect to be contributing to Wikimedia two years from now.
-
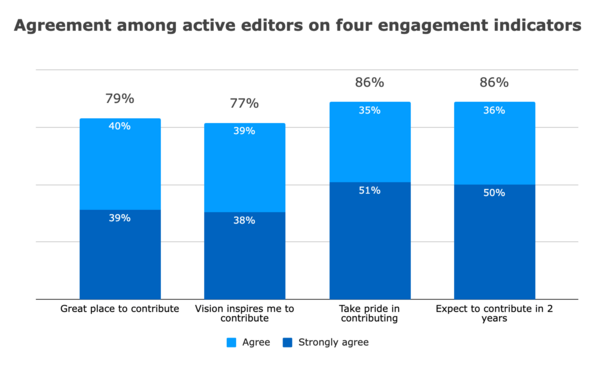 Figure 11. Agreement among active editors on four engagement statements.

Contributors shared a high level of agreement to engagement indicators about the extent they identify with, are inspired by, and promote being a part of the Wikimedia movement and its projects. On all scales, a large majority of respondents agreed, ranging from 77% to 86% agreement overall. Disagreement was highest for the inspiring vision item (8%) and lowest for pride in contributing as well as expectation to contribute in 2 years (each 3%). This pattern was largely consistent across roles, though we did find that Admins were more likely to disagree that they recommend Wikimedia projects as a great place to contribute (16% disagree while 74% agree)[18] and that the vision to share in the sum of all knowledge inspires them to contribute more than elsewhere (16% disagree while 70% agree)[19] compared to other roles, while Organizers were more likely to agree that the vision inspires them to contribute (90%), that they take pride in contributing (95%)[20], and that they expect to be contributing in 2 years (96%)[21].
Sense of belonging, having one’s voice heard in their community and the broader movement, and satisfaction with decision making[edit]
We likewise asked respondents to rate the degree to which they agree or disagree with the following statements:
- I feel like I belong in the Wikimedia movement
- I feel respected in the Wikimedia movement
- I feel that my voice is heard in decisions made in my community
- I feel that my voice is heard in decisions made in the Wikimedia movement
- There is open and honest communication between different organizations and groups in the Wikimedia movement
- I am satisfied with the Wikimedia movement's decision-making processes
-
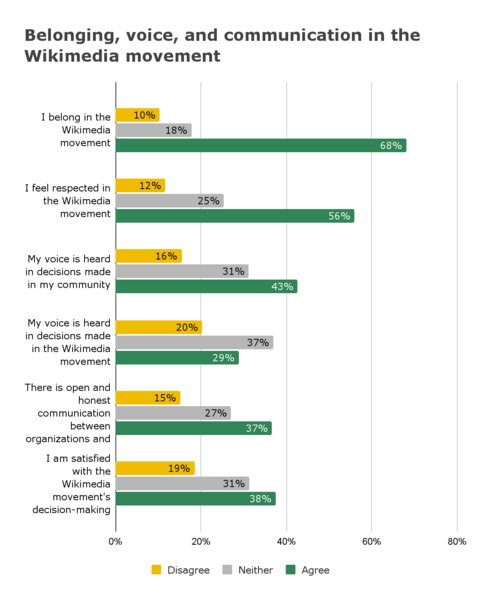 Figure 12. Belonging, voice, and communication in the Wikimedia movement

Overall, contributors agreed most that they belong (68%) and that they feel respected in the Wikimedia movement (56%). Contributors were also more likely to agree that their voice is heard in decisions made in their community or communities (43%) than in the broader Wikimedia movement (29%), where the most frequent response was “neither agree nor disagree” (37%).
In 2022, respondents were more likely to agree (37%) that there is open and honest communication between organizations and groups in the Wikimedia movement than they were in 2020 (30%)[22]. They were also slightly less likely to disagree that they are satisfied with the Wikimedia movement’s decision-making processes in 2022 (19%) compared to 2020 (21% disagreement)[23]. There were no significant differences between years on the other questions, although each had a slightly higher percent of agreement in 2022.
Safety & Inclusion[edit]
The safety and inclusion section of the survey asked questions about how often active editors felt unsafe or uncomfortable contributing on wikis, how often they experienced harassment, and whether they know how to get help if they do experience harassment. We likewise asked about their sentiments towards user conduct policies in their communities.
Key findings:
- 35% of active editors responded they had felt unsafe or uncomfortable contributing to Wikimedia projects at least once in the preceding 12 months.
- Women (44%), gender diverse editors (53%), and those who preferred not to state their gender (45%) were more likely to indicate having felt unsafe or uncomfortable contributing, while men were less likely to do so (33%).
- 25% of editors responded that they had been harassed in any Wikimedia space at least once in the preceding 12 months.
- Newcomers were less likely to respond that they had been harassed (21%) compared to those who have been contributing for longer (26%).
- Women were more likely to respond that they had experienced harassment (31%) compared to those who did not identify as women (24%).
- 46% of editors agreed that they know how to get help if someone is harassing them on Wikimedia projects.
- Compared to seasoned editors (49%), newcomers (37%) were less likely to know where to get help.
- English (43%), Russian (32%), and Chinese-language (33%) Wikipedians were less likely to agree they felt confident they would get the support they needed compared to other language projects (47-48%).
- Gender diverse respondents were less likely to agree they felt confident they would get the support they need if they were harassed (35% compared to 47%).
- Overall, 60% of editors agreed that the user conduct policies on the projects are appropriate for their community or communities; 53% agreed that they are sufficient for their community or communities; while a relatively smaller percent – 43% – were satisfied with how user conduct policies were enforced on their wikis.
Rules or laws which cause hesitancy to contribute[edit]
-
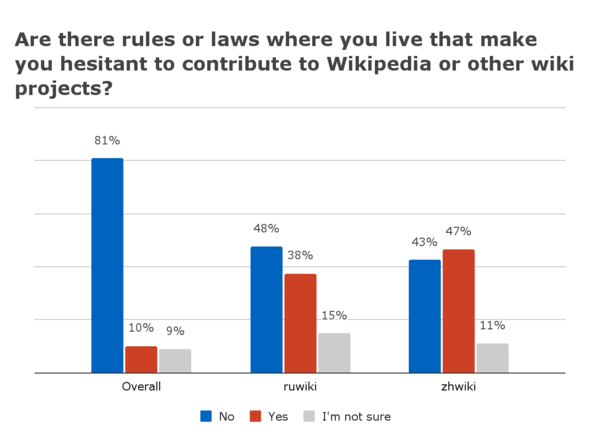 Figure 13. Contributors to Russian and Chinese-language Wikipedias were more likely to state that there are laws where they live which make them hesitant to contribute.

In 2022, 10% of active editors responded that there are rules or laws where they live which make them hesitant to contribute on Wikipedia or other wiki projects; this has not changed since 2020. However, two notable exceptions exist to this statistic: among Chinese-language Wikipedia editors, 47% reported that there were such rules or laws where they live, while among Russian-language Wikipedia editors 38% did so, a substantial increase among Russian Wikipedia editors from 20% in 2020[24].
Feeling unsafe or uncomfortable contributing to Wikimedia projects[edit]
In 2022, 35% of active editors responded they had felt unsafe or uncomfortable contributing to Wikimedia projects at least once in the preceding 12 months. There was no statistically significant difference on this question from 2020, when 33% of respondents indicated they had felt unsafe or uncomfortable contributing.
Compared to Editors (34%), Admins were more likely to indicate having felt unsafe or uncomfortable (42%), while Organizers (37%) were not statistically different from either Editors or Admins[25].
-
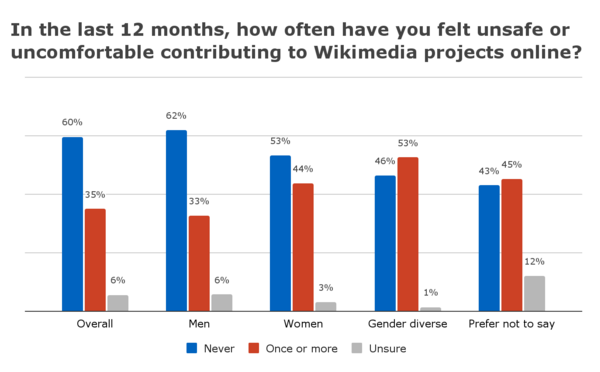 Figure 14. Percent of respondents who indicated feeling unsafe or uncomfortable in the 12 months preceding the survey, by gender.

Women (44%)[26], gender diverse editors (53%)[27], and those who preferred not to state their gender (45%)[28] were more likely to indicate having felt unsafe or uncomfortable contributing, while men were less likely to do so (33%)[29]. Those who identified as belonging to a discriminated group in their countries of residence (48%) were likewise more likely to indicate having felt unsafe or uncomfortable compared to those who did not identify as such (30%)[30]. There were no statistically significant differences on this question among those who identified as belonging to an ethnic minority group compared to those who did not identify as such.
Comparing across the survey’s project groups, German-language Wikipedia (44% compared to 34%)[31], Spanish-language Wikipedia (50% compared to 34%)[32], and Portuguese-language Wikipedia users (58% compared to 35%)[33] were more likely to have felt unsafe or uncomfortable compared to all other project contributors, while English-language Wikipedia users were less likely to have felt so (27% compared to 38% among other projects)[34].
Harassment in Wikimedia spaces[edit]
In 2022, 25% of active editors responded that they had been harassed in a Wikimedia space at least once in the 12 months preceding the survey. Although, to our knowledge, no global or platform-based comparisons exist for this data, the US-based Anti-Defamation League’s nationally representative 2021 survey on hate and harassment on social media found that 41% of their survey respondents experienced harassment in the preceding 12 months[35].
As with other safety data in the Community Insights report, there was variation among role types, projects, and demographic categories on this question.
Admins (42%) and Organizers (34%) were more likely to respond that they had experienced harassment compared to Editors (22%)[36].
-
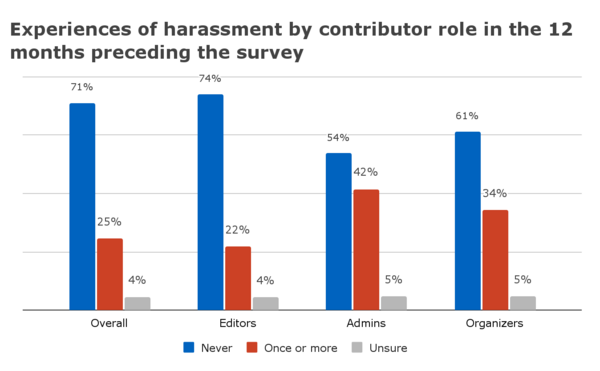 Figure 15. Respondent experiences of harassment in the 12 months preceding the survey, by contributor role type.

Newcomers – active editors who began contributing in 2021 or 2022 – were less likely to respond that they had been harassed in the preceding 12 months (21%) compared to those who have been contributing for longer (26%)[37].
Among gender categories, women were more likely to respond that they had experienced harassment in the preceding 12 months (31%) compared to those who did not identify as women (24%)[38]. Differences between other gender categories were not statistically significant[39].
Those who identified as belonging to a discriminated group in their countries of residence were also more likely to respond that they had experienced harassment (33%) compared to those who did not identify as such (22%)[40].
- Among those who identified as being discriminated against on the basis of social or economic class, 49% responded that they had experienced harassment[41].
- For those who indicated they were discriminated against on the basis of nationality, 36% responded that they had experienced harassment[42].
No other identity categories related to statistically significant differences, though every individual category indicated experiencing harassment at similar rates to the overall group who identified as belonging to a discriminated group (each around 33%, per above).
Portuguese-language Wikipedia users showed statistically significant differences compared to other projects on this question: 67% responded they had experienced harassment, compared to 24% among all other projects[43]. We caution that the margins of error for this data point are ±15.6% due to a small sample size among ptwiki contributors (N = 33), meaning our estimate for the ptwiki population would range between 51% to 83%. We thus encourage readers to interpret this data point as “a difference exists” rather than a precise percent of harassment experience.
Knowing where to get help[edit]
Overall, 46% of active editors agreed that they know how to get help if someone is harassing them on Wikimedia projects. There were differences in responses to this question based on role and tenure: Administrators were most likely to agree they know how to get help (75%) compared to Organizers (55%) and Editors (41%)[44]. Compared to seasoned editors (49%) – those who had been contributing since 2020 or earlier – newcomers (37%) were less likely to agree they knew where to get help[45].
-
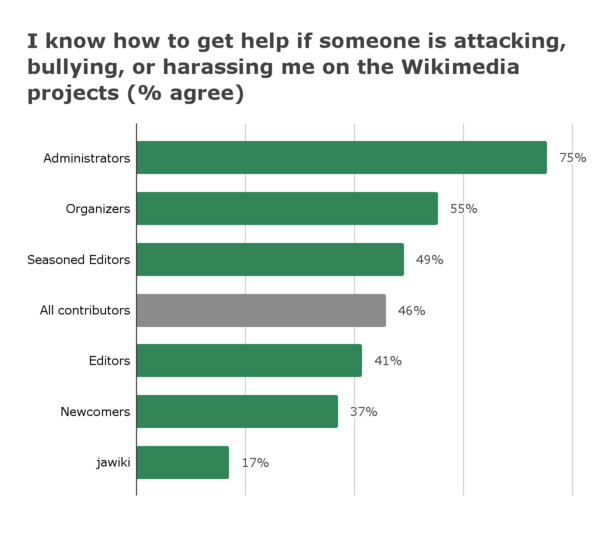 Figure 16. Percent of respondents who agreed they know where to get help if they experience harassment

Despite substantial variation in processes and procedures for dealing with on-wiki conflicts across projects and languages, responses on this question across project groups were similar with one exception: only 17% of Japanese-language Wikipedia editors agreed they knew where to get help if they needed it, compared to 47% of other project contributors[46].
We saw no statistically significant differences in agreement on this question between gender identity categories, ethnic minority group belonging, or discriminated group belonging.
Confidence in getting needed support[edit]
Similar to knowing how to get help, 46% of contributors overall agreed they felt confident they would get the support they needed if they were attacked, bullied, or harassed. However, again there was variation on this question. Although 75% of Admins knew how to get help, a substantially smaller proportion – 53% – felt confident that they would get the support they needed, though they were still more likely to agree compared to Editors (45%)[47]. Conversely, while newcomers were less likely to know how to get help (37%), they were no different from other editors in feeling confident they would get support (47% among both newcomers and seasoned editors).
Among project groups, English-language (43% compared to 48%)[48], Russian-language (32% compared to 47%)[49], and Chinese-language (33% compared to 47%)[50] Wikipedians were less likely to agree they felt confident they would get the support they needed. Japanese-language Wikipedians were also less likely to feel confident they would get the support they needed (24% compared to 48%)[51], though they were more confident in getting support compared to knowing how to get help (from above, 17%). Wikimedians contributing to Central and Eastern European & Central Asian language projects (not inclusive of Russian) were more likely to agree (58%) they felt confident they would get the support they need compared to other projects (46%)[52].
Gender diverse respondents were less likely to agree they felt confident they would get the support they need if they were harassed (35% compared to 47% among all other gender categories)[53]. Likewise, people who identified as belonging to a discriminated group in their country of residence (38%) and those who were unsure about whether they do (38%) were both less likely to agree they felt confident they would get the support they need compared to those who did not identify as belonging to a discriminated group (51%)[54].
User conduct policies[edit]
Overall, 60% of respondents agreed that the user conduct policies on the projects are appropriate for their community or communities, a decrease from 64% agreement in 2020[55]; 53% agreed that they are sufficient for their community or communities; while a relatively smaller percent – 43% – were satisfied with how user conduct policies were enforced on their wikis. Again, we saw differences across roles, projects, and demographic groups.
-
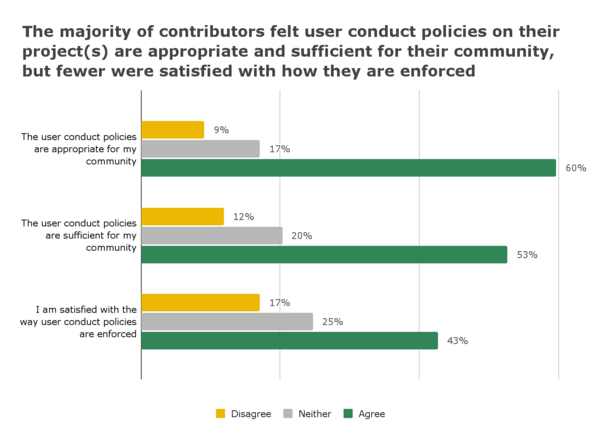 Figure 17. Distribution of responses to three statements on user conduct policies. These statements were prompted by the question "For the Wikimedia projects you participate in, how much do you agree or disagree with the following statements about user conduct policies?"

Editors were less likely to agree that the user conduct policies were appropriate (57%) compared to Admins (72%) and Organizers (69%)[56]. Admins were more likely to agree the user conduct policies are sufficient (64%) compared to Editors (51%), but neither group was statistically significantly different from Organizers (54%) in agreement[57]. Differences in agreement between the three roles on the question of enforcement of user conduct policies were not statistically significant, however 42% of surveyed Editors agreed while 48% of Admins and Organizers agreed.
-
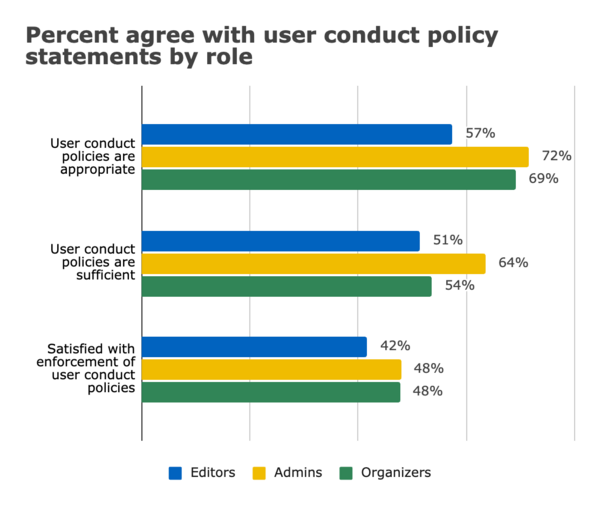 Figure 18. Percent of admins, editors, and organizers who agreed with each statement about user conduct policies on the Wikimedia projects they participate in.

There was some variation between wikis. On the appropriateness of conduct policies, ruwiki (31%) contributors were less likely to agree compared to other project contributors (61%)[58]. On the sufficiency of user conduct policies, jawiki users were less likely to agree (37% compared to 54% among other project contributors)[59]. Regarding satisfaction with enforcement of conduct policies, enwiki users were less likely to agree (35% compared to 46% among other wikis)[60], while Italian-language Wikipedia contributors were more likely to agree (59% compared to 42% among other wikis)[61].
We saw no statistically significant differences regarding whether users felt policies were appropriate across gender identities. However, on the question of whether existing policies were sufficient, respondents who identified as men were more likely to agree (54%) compared to those who did not identify as men (48%)[62]. On the question of satisfaction with enforcement of user conduct policies, respondents who identified as men were more likely to agree (45%)[63], while respondents who identified as women (33%)[64] and those who were categorized as gender diverse (29%)[65] were less likely to agree.
-
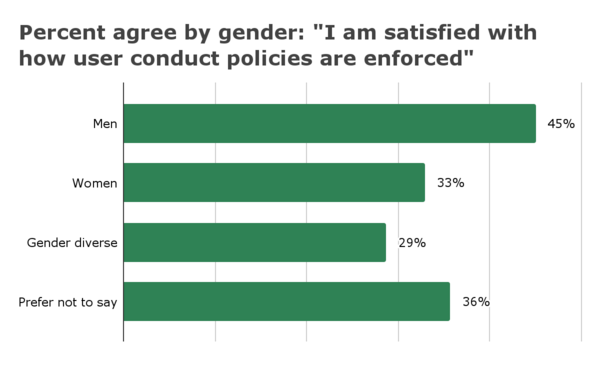 Figure 19. Percent agreement with the statement "I am satisfied with the way user conduct policies are enforced" by gender.

Those who identified as belonging to a discriminated group were less likely to agree that policies are appropriate (52%)[66] or sufficient (44%)[67] compared to those who did not identify as such (63% for appropriate, and 56% for sufficient). They were likewise less likely to agree they are satisfied with how user conduct policies are enforced on their wikis (34%) compared to those who did not identify as belonging to a discriminated group (46%)[68].
Role-specific questions[edit]
We asked a few small sets of role-specific questions of survey participants depending on their on- and off-wiki roles or their relative newness to editing. This included questions specific to on-wiki contributing, learning to edit, on-wiki administration, and movement organizing.
Key findings:
- On-wiki contributors were more likely to agree they are satisfied with decision-making on their projects in 2022 (54%) compared to 2020 (50%).
- Newcomers agreed more often that learning the editing tools (70%) and generally learning to edit (69%) were easy compared to learning editing policies (48%).
- Nine in 10 administrators agreed they know how to address challenges in their roles, but were less likely to agree that they usually have the resources they need to address these challenges (73%).
- Nine in 10 organizers agreed they have people who can help them to implement their projects, three in four agreed they have they materials and tools they need, while a little over half (55%) agreed they have access to the necessary funding.
On-wiki contributors[edit]
For respondents who indicated that they create, contribute, and/or edit content on at least one Wikimedia project, we asked to what extent they agree or disagree with two statements:
- I am satisfied with how decisions are made in my Wikimedia project or activities
- I am confident in the ability of admins on my project to make fair decisions about user conduct issues
-
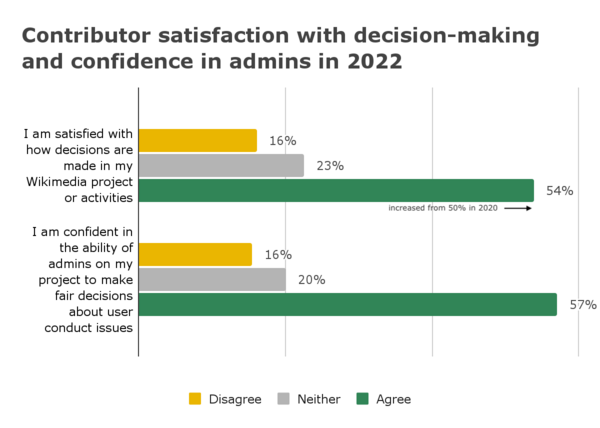 Figure 20. On-wiki contributor satisfaction with decision-making in their project or activity, and confidence in admins to make fair decisions.

Overall, 54% of contributors were satisfied with how decisions are made in their project or activities, an increase from 50% in 2020[69]. About three out of five (57%) were confident in the ability of admins on their project to make fair decisions about user conduct issues, with no change on this question since 2020.
Contributors who also serve as Admins were more likely agree they are satisfied with decision-making on their projects (72%) compared to Editors (51%) and Organizers (58%)[70]. They were also more likely to have confidence in the ability of admins on their projects to make fair decisions about user conduct issues (68%) compared to Editors (56%), while neither group was statistically significantly different from Organizers (59%)[71].
Among project groups, jawiki contributors were less likely to agree (43%) they were satisfied with how decisions are made on their wiki project compared to other project contributors (54%)[72], and they were less likely to agree that they have confidence in their admins to make fair decisions about user conduct policies (42%) compared to other project contributors (58%)[73]. Commons contributors were more likely to agree (65%) they have confidence in their admins to make fair decisions about user conduct policies compared to other project contributors (56%)[74].
Respondents who identified as men (56%)[75] were more likely to agree they are satisfied with how decisions are made in their project or activities, while those who identified as women (46%)[76] and those who were categorized as gender diverse (34%)[77] were less likely to agree. Men were also more likely to agree (59%)[78] that they are confident in the ability of admins to make fair decisions about user conduct issues, while those who were categorized as gender diverse (45%)[79] were less likely to agree.
Those who identified as belonging to a discriminated group were less likely to agree (45%) they are satisfied with how decisions are made in their project or activities compared to those who did not identify as such (57%)[80], and were also less likely to agree (49%) that they have confidence in admins to make fair decisions about user conduct issues compared to those who did not identify as belonging to a discriminated group (60%)[81].
Newcomers’ ease of learning to edit[edit]
For contributors who indicated they had started editing in 2022 or 2021, we asked three questions regarding the ease of generally learning to edit, the ease of learning to use editing tools, and the ease of learning the editing policies.
-
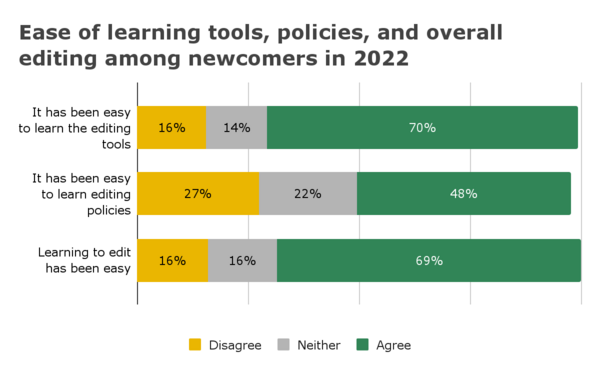 Figure 21. Newcomers -- those who began editing in 2021 or 2022 -- ease of learning editing tools, policies, and overall learning how to edit

Overall, newcomers were more likely to agree that learning the editing tools (70%) and generally learning to edit (69%) were easy compared to learning editing policies (48%). While there was no statistically significant change regarding the ease of learning the editing tools since 2020, agreement about learning to edit generally fell from 80% agreement in 2020[82], and agreement that it has been easy to learn editing policies fell from 62% in 2020[83].
Although this year-over-year change may indicate cause for concern, we should consider that this sample of newcomer editors is in many ways unique from other new editors: they are active editors who made at least 5 edits in 2 of the 3 months preceding the survey, meaning they were retained for more than 2 months of editing, and over half of them made more than 150 edits in the preceding year. This data may be showing us that despite the difficulty of learning to edit Wikimedia projects, newcomers are staying in the Movement. Nevertheless, these questions indicate room for improvement, especially regarding the complexity of learning editing policies and how policy structures could be made more digestible for new editors. As the Africa Growth Pilot on Core Policies tutorials is implemented, we can look to this project’s successes and spaces for improvement for onboarding new Wikimedians to editing policies.
Administrators[edit]
We asked respondents who indicated they serve in an on-wiki administrative role (for example, as an admin, bureaucrat, or steward) to what extent they agree or disagree on three statements specific to their role: “When I am presented with a challenge in my on-wiki role…”
- I usually know how to address it
- I am usually able to address it in the way I think is most appropriate
- I usually have the resources I need to address it
-
 Figure 22. Administrators' capacity to address challenges and access to necessary resources within their role

A strong majority of on-wiki admins agreed that, when presented with a challenge in their role, they usually know how to address it (92%) and are able to address it in the way they think is most appropriate (89%). However, fewer agreed they usually have the resources they need to address challenges (73%). We found no statistically significant differences on these questions from comparing 2022 data to 2020 data.
Across grouped Wikimedia regions, admins based in Established regions were more likely to agree that they usually know how to address challenges (96%) compared to those from Developing and Emerging regions (88%, grouped).[84] Administrators from Emerging regions were less likely to agree (48%) that they have the resources they need to address challenges compared to those from Developing (73%) and Established (79%) regions[85].
Organizers[edit]
For respondents who indicated that they organize Wikimedia projects, events, campaigns or groups, we asked to what extent they agree or disagree with five statements specific to their roles as organizers:
- I have people who can help me with my Wikimedia events, campaigns, groups, or partnerships.
- I have access to the right tools or software to implement my Wikimedia events, campaigns, groups, or partnerships.
- I have access to documentation and training materials to help me implement my Wikimedia events, campaigns, groups, or partnerships.
- I have access to communications materials and tools that help me reach the people that I want to engage with my events, campaigns, groups, or partnerships.
- I have access to funding that I need to implement my events, campaigns, groups, or partnerships.
-
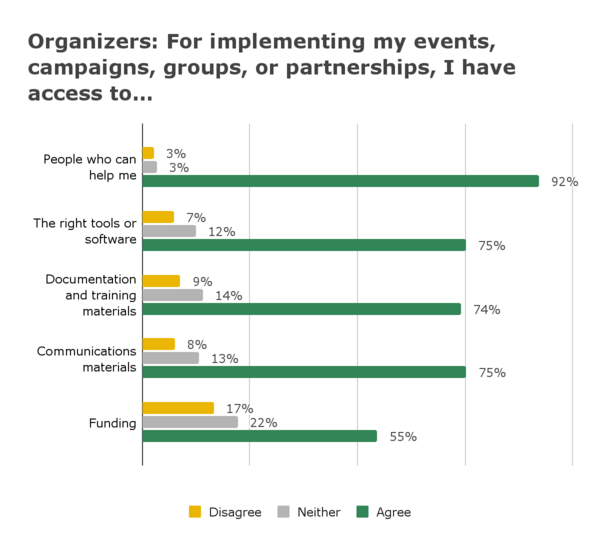 Figure 23. Organizer access to social and material support to implement their projects.

Nine out of ten (92%) Organizers agreed they have people who can help them, which increased from 81% in 2020[86]. Three quarters agreed they have the right tools or software (75%, increased from 60% in 2020)[87], documentation and training materials (74%), and communications materials to reach the people they want to engage (75%, increased from 59% in 2020)[88]. A little over half (55%) agreed they have access to the funding they need to implement their events, campaigns, groups or partnerships, with no statistically significant change from 2020.
Key terms[edit]
- Active editors - Active editors are defined as those who had made at least 5 edits in two of the three months preceding the survey, for a minimum of 10 edits for eligibility for the survey. When we refer to "active editors", we mean our randomly sampled survey participants and, by extension, all active editors across Wikimedia spaces as the survey is meant to estimate data for the entire population.
- Gender diverse - We borrow the term “gender diverse” from the UN OHCHR and other groups, and use it as an umbrella term for all respondents who identified as transgender, non-binary, genderqueer, agender, and all other non-binary gender descriptors, as well as users who identified with multiple gender descriptors. For the categories of men and women, all respondents who identified as men or women are included in the descriptive data and analyses (for example, a respondent who selected that they identify as a woman and as non-binary would be included in both the category for women and for gender diverse people). Thus, totals for gender charts may add to over 100%. We periodically use the language "categorized as gender diverse" to indicate that this is a researcher's word choice and variable construction combining multiple gender categories, identities, and self-descriptions within the survey rather words that respondents might use to describe themselves.
- Project Group - When we determine our samples, we stratify them by projects. Larger projects are their own strata, for example English or French Wikipedia, while for smaller wikis we combine projects by regional language mapping, such as the Central and Eastern European languages.
- Roles - For our analyses, we categorize respondents into three role types when analyzing differences between groups: Editors, Organizers, and Admins. Each category is mutually exclusive for the purposes of analysis, though respondents often occupy multiple roles.
- Editors are users who indicated that they contribute to Wikimedia projects online, including Developers contributing code.
- Organizers are respondents who indicated that they organize Wikimedia projects, events, campaigns, or groups, that they are a primary contact or staff of a Wikimedia Affiliate, or have received a grant (including those who identified as Editors and Developers).
- Admins are respondents who indicated that they serve in an on-wiki adminstrative role (including those who are Editors and Organizers).
- Regions - Based on the distribution of average regional signals, there are three groups: Emerging (1st quartile), Developing (Middle 50th percentile, 2&3 quartiles), Established (4th quartile). These regional groupings are based on the Wikimedia Foundation grants regions.
- Statistically significant - When we note that a difference is statistically signficant, it means that our data indicates that there is a high likelihood that this difference is likely to reflect a broader population beyond our survey sample. However, when something is not statistically signficant, that does not mean that a difference may not exist; it simply means our data cannot tell us whether it does.
Methodology[edit]
The 2022 Community Insights survey methodology primarily replicated the 2020 survey methodology.
Sampling
We use stratified random sampling of active editors on all wikis, split into 23 strata of large wikis and grouped smaller wiki projects. The users were then sampled by editing activity category (edit bins) over the last year within those strata, in inverse proportion to that bin’s response rate for the 2020 survey. In total, 23,695 users across wiki projects were randomly selected into the sample for the 2022 Community Insights survey.
Eligibility criteria
- At least 5 edits in 2 of the 3 months preceding the survey (minimum 10 edits)
- “Email this user” feature was turned on (~85% of users)
Weighting
To account for variation in response rates, we use inverse propensity score matching by project strata and edit bin.
Response rates
Of the 23,695 contributors randomly selected from across Wikimedia projects, and 4122 of them (17.4%) agreed to be sent a link to the survey. Of those who opted in to take the survey, 3012 (73%) began the survey, and 2870 (70%) completed the entire survey. This results in a 12.1% cumulative response rate[89].
Analyses
Most analyses for the 2023 report were conducted using a Pearson's chi-squared test, with z-test comparisons between categories to understand where differences were evident.
Footnotes[edit]
- ↑ We borrow the term “gender diverse” from the UN OHCHR and other groups, and use it as an umbrella term for all respondents who identified as transgender, non-binary, genderqueer, agender, and all other non-binary gender descriptors, as well as users who identified with multiple gender descriptors. For the categories of men and women, all respondents who identified as men or women are included in the descriptive data and analyses (for example, a respondent who selected that they identify as a woman and as non-binary would be included in both the category for women and for gender diverse people). Thus, totals may add to over 100%.
- ↑ As a comparison, based on human sex ratios about 50% of the world is made up of men, 50% of women, with estimates that 0.1 to 2% of people identify as transgender or nonbinary across the globe. See Goodman, M. et al. Size and distribution of transgender and gender nonconforming populations: A narrative review. Endocrinol. Metab. Clin. N. Am. 48, 303–321 https://doi.org/10.1016/j.ecl.2019.01.001 for global estimates on gender diverse identities.
- ↑ X2 (2, N = 1977) = 40.617, p = <.001; comparisons in categories are conducted using a z-test at p = .05.
- ↑ X2 (2, N = 3325) = 30.349, p = <.001; comparisons in categories are conducted using a z-test at p = .05.
- ↑ OECD (2022), "Educational attainment of 25-64 year-olds (2021): Percentage of adults with a given level of education as the highest level attained", in Education at a Glance 2022: OECD Indicators, OECD Publishing, Paris, https://doi.org/10.1787/5e744105-en.
- ↑ https://www.ohchr.org/en/minorities/united-nations-guide-minorities
- ↑ https://www.kff.org/other/state-indicator/distribution-of-nonelderly-adults-by-race-ethnicity/?currentTimeframe=0&sortModel=%7B%22colId%22:%22Location%22,%22sort%22:%22asc%22%7D
- ↑ https://www.ethnicity-facts-figures.service.gov.uk/uk-population-by-ethnicity/national-and-regional-populations/population-of-england-and-wales/latest#by-ethnicity
- ↑ X2 (6, N = 5497) = 139.635, p = <.001; comparisons in categories are conducted using a z-test at p = .05.
- ↑ X2 (6, N = 1955) = 54.520, p = <.001; comparisons in categories are conducted using a z-test at p = .05.
- ↑ For our grouped regions, Established regions are Northern America & Northern and Western Europe; Developing regions are Central and Eastern Europe and Central Asia, Middle East and North Africa, & South Asia; Emerging regions are Latin America and the Caribbean, Sub-Saharan Africa, and East and Southeast Asia and the Pacific. These categorizations are based on levels of editorship within the Wikimedia ecosystem.
- ↑ X2 (6, N = 1769) = 74.890, p = <.001; comparisons in categories are conducted using a z-test at p = .05.
- ↑ X2 (6, N = 783) = 39.976, p = <.001; comparisons in categories are conducted using a z-test at p = .05.
- ↑ X2 (6, N = 2235) = 36.217, p = <.001; comparisons in categories are conducted using a z-test at p = .05.
- ↑ X2 (3, N = 3427) = 8.169, p = .043; comparisons in categories are conducted using a z-test at p = .05.
- ↑ X2 (6, N = 1778) = 69.466, p = <.001; comparisons in categories are conducted using a z-test at p = .05.
- ↑ X2 (6, N = 1767) = 15.528, p = .017; comparisons in categories are conducted using a z-test at p = .05.
- ↑ X2 (6, N = 2075) = 40.348, p = <.001; comparisons in categories are conducted using a z-test at p = .05.
- ↑ X2 (6, N = 2072) = 38.246, p = <.001; comparisons in categories are conducted using a z-test at p = .05.
- ↑ X2 (6, N = 2070) = 12.912, p = .044; comparisons in categories are conducted using a z-test at p = .05.
- ↑ X2 (6, N = 2071) = 18.837, p = .004; comparisons in categories are conducted using a z-test at p = .05.
- ↑ X2 (3, N = 3402) = 21.125, p = <.001; comparisons in categories are conducted using a z-test at p = .05.
- ↑ X2 (3, N = 3408) = 8.251, p = .041; comparisons in categories are conducted using a z-test at p = .05.
- ↑ X2 (4, N = 215) = 10.419, p = .034; comparisons in categories are conducted using a z-test at p = .05.
- ↑ X2 (4, N = 2034) = 9.667, p = .046; comparisons in categories are conducted using a z-test at p = .05.
- ↑ X2 (2, N = 1970) = 11.825, p = .003; comparisons in categories are conducted using a z-test at p = .05
- ↑ X2 (2, N = 1971) = 12.428, p = .002; comparisons in categories are conducted using a z-test at p = .05
- ↑ X2 (6, N = 1969) = 39.716, p = <.001; comparisons in categories are conducted using a z-test at p = .05.
- ↑ X2 (2, N = 1970) = 20.888, p = <.001; comparisons in categories are conducted using a z-test at p = .05
- ↑ X2 (6, N = 1963) = 58.037, p = <.001; comparisons in categories are conducted using a z-test at p = .05.
- ↑ X2 (2, N = 2033) = 11.609, p = <.001; comparisons in categories are conducted using a z-test at p = .05.
- ↑ X2 (2, N = 2032) = 8.466, p = .015; comparisons in categories are conducted using a z-test at p = .05.
- ↑ X2 (2, N = 2032) = 7.657, p = .022; comparisons in categories are conducted using a z-test at p = .05.
- ↑ X2 (2, N = 2034) = 28.774, p = <.001; comparisons in categories are conducted using a z-test at p = .05.
- ↑ https://www.adl.org/resources/report/online-hate-and-harassment-american-experience-2021
- ↑ X2 (4, N = 2028) = 46.811, p = <.001; comparisons in categories are conducted using a z-test at p = .05.
- ↑ X2 (2, N = 1930) = 8.372, p = .015; comparisons in categories are conducted using a z-test at p = .05.
- ↑ X2 (2, N = 1970) = 7.419, p = .024; comparisons in categories are conducted using a z-test at p = .05.
- ↑ X2 (6, N = 1968) = 11.384, p = .077; comparisons in categories are conducted using a z-test at p = .05. The following data is not statistically significantly different from other gender categories: 27% of those who preferred not state their gender, 26% of gender diverse people, and 23% of men responded they had experienced harassment.
- ↑ X2 (6, N = 1962) = 31.111, p = <.001; comparisons in categories are conducted using a z-test at p = .05.
- ↑ X2 (2, N = 1911) = 23.854, p = <.001; comparisons in categories are conducted using a z-test at p = .05.
- ↑ X2 (2, N = 1913) = 18.091, p = <.001; comparisons in categories are conducted using a z-test at p = .05.
- ↑ X2 (2, N = 2028) = 32.325, p = <.001; comparisons in categories are conducted using a z-test at p = .05.
- ↑ X2 (6, N = 2009) = 93.296, p = <.001; comparisons in categories are conducted using a z-test at p = .05.
- ↑ X2 (2, N = 1912) = 21.805, p = <.001; comparisons in categories are conducted using a z-test at p = .05.
- ↑ X2 (3, N = 2010) = 33.967, p = <.001; comparisons in categories are conducted using a z-test at p = .05.
- ↑ X2 (6, N = 2002) = 24.544, p = <.001; comparisons in categories are conducted using a z-test at p = .05.
- ↑ X2 (3, N = 2001) = 10.149, p = .017; comparisons in categories are conducted using a z-test at p = .05.
- ↑ X2 (3, N = 2002) = 13.078, p = .004; comparisons in categories are conducted using a z-test at p = .05.
- ↑ X2 (3, N = 2003) = 8.854, p = .031; comparisons in categories are conducted using a z-test at p = .05.
- ↑ X2 (3, N = 2002) = 19.574, p = <.001; comparisons in categories are conducted using a z-test at p = .05.
- ↑ X2 (3, N = 2003) = 9.118, p = .028; comparisons in categories are conducted using a z-test at p = .05.
- ↑ X2 (3, N = 1956) = 10.764, p = .013; comparisons in categories are conducted using a z-test at p = .05.
- ↑ X2 (9, N = 1950) = 48.485, p = <.001; comparisons in categories are conducted using a z-test at p = .05.
- ↑ Although the chi-squared test comparing years was not significant at the .05 level (X2 (3, N = 2721) = 6.973, p = <.073) on this item, the z-test of difference between categories by year was significant at the p = .05 level for both agreement and disagreement. We thus conducted a t-test between years to see if there was a difference in means when we removed the “Unsure” category to make a 3-point scale from 1=Disagree, 2= Neither agree nor disagree, 3=Agree. We saw a statistically significant decrease in the mean in 2022 (N=1715, M=2.5887, SD=.67450) compared to 2020 (N=634, M=2.6600, SD=.61343), t(1234)=2.343, p = .015, indicating a trend towards disagreement in 2022.
- ↑ X2 (6, N = 1997) = 30.876, p = <.001; comparisons in categories are conducted using a z-test at p = .05.
- ↑ X2 (6, N = 1986) = 38.021, p = <.001; comparisons in categories are conducted using a z-test at p = .05.
- ↑ X2 (3, N = 1998) = 42.059, p = <.001; comparisons in categories are conducted using a z-test at p = .05.
- ↑ X2 (3, N = 1983) = 10.475, p = .015; comparisons in categories are conducted using a z-test at p = .05.
- ↑ X2 (3, N = 1986) = 20.993, p = <.001; comparisons in categories are conducted using a z-test at p = .05.
- ↑ X2 (3, N = 1986) = 8.069, p = .045; comparisons in categories are conducted using a z-test at p = .05.
- ↑ X2 (3, N = 1942) = 7.873, p = .049; comparisons in categories are conducted using a z-test at p = .05.
- ↑ X2 (3, N = 1942) = 18.893, p = <.001; comparisons in categories are conducted using a z-test at p = .05.
- ↑ X2 (3, N = 1942) = 14.028, p = .003; comparisons in categories are conducted using a z-test at p = .05.
- ↑ X2 (3, N = 1941) = 21.738, p = <.001; comparisons in categories are conducted using a z-test at p = .05.
- ↑ X2 (9, N = 1946) = 35.653, p = <.001; comparisons in categories are conducted using a z-test at p = .05.
- ↑ X2 (9, N = 1936) = 42.727, p = <.001; comparisons in categories are conducted using a z-test at p = .05.
- ↑ X2 (9, N = 1934) = 37.937, p = <.001; comparisons in categories are conducted using a z-test at p = .05.
- ↑ X2 (3, N = 3276) = 11.130, p = .011; comparisons in categories are conducted using a z-test at p = .05.
- ↑ X2 (6, N = 1960) = 41.896, p = <.001; comparisons in categories are conducted using a z-test at p = .05.
- ↑ X2 (6, N = 1962) = 21.914, p = .001; comparisons in categories are conducted using a z-test at p = .05.
- ↑ X2 (3, N = 1960) = 7.990, p = .046; comparisons in categories are conducted using a z-test at p = .05.
- ↑ X2 (3, N = 1963) = 15.358, p = .002; comparisons in categories are conducted using a z-test at p = .05.
- ↑ X2 (3, N = 1962) = 8.638, p = .035; comparisons in categories are conducted using a z-test at p = .05.
- ↑ X2 (3, N = 1949) = 13.225, p = .004; comparisons in categories are conducted using a z-test at p = .05.
- ↑ X2 (3, N = 1949) = 8.210, p = .042; comparisons in categories are conducted using a z-test at p = .05.
- ↑ X2 (3, N = 1949) = 28.491, p = <.001; comparisons in categories are conducted using a z-test at p = .05.
- ↑ X2 (3, N = 1950) = 8.984, p = .030; comparisons in categories are conducted using a z-test at p = .05.
- ↑ X2 (3, N = 1949) = 12.129, p = .007; comparisons in categories are conducted using a z-test at p = .05.
- ↑ X2 (9, N = 1944) = 53.248, p = <.001; comparisons in categories are conducted using a z-test at p = .05.
- ↑ X2 (9, N = 1945) = 36.073, p = <.001; comparisons in categories are conducted using a z-test at p = .05.
- ↑ X2 (3, N = 510) = 13.118, p = .004; comparisons in categories are conducted using a z-test at p = .05.
- ↑ X2 (3, N = 512) = 12.046, p = .007; comparisons in categories are conducted using a z-test at p = .05.
- ↑ X2 (3, N = 182) = 7.911, p = .048; comparisons in categories are conducted using a z-test at p = .05.
- ↑ X2 (6, N = 182) = 15.573, p = .016; comparisons in categories are conducted using a z-test at p = .05.
- ↑ X2 (3, N = 314) = 12.236, p = .007; comparisons in categories are conducted using a z-test at p = .05.
- ↑ X2 (3, N = 313) = 9.619, p = .022; comparisons in categories are conducted using a z-test at p = .05.
- ↑ X2 (3, N = 313) = 10.083, p = .018; comparisons in categories are conducted using a z-test at p = .05.
- ↑ As a comparison, the 2022 Pew American Trends panel cumulative response rate was 4%. See: https://www.pewresearch.org/journalism/2023/04/18/podcasts-methodology/